gspatial_plot package
The examples mentioned in the documentation is also part of examples jupyter notebook present in the github repo, So feel free to download it and play with it.
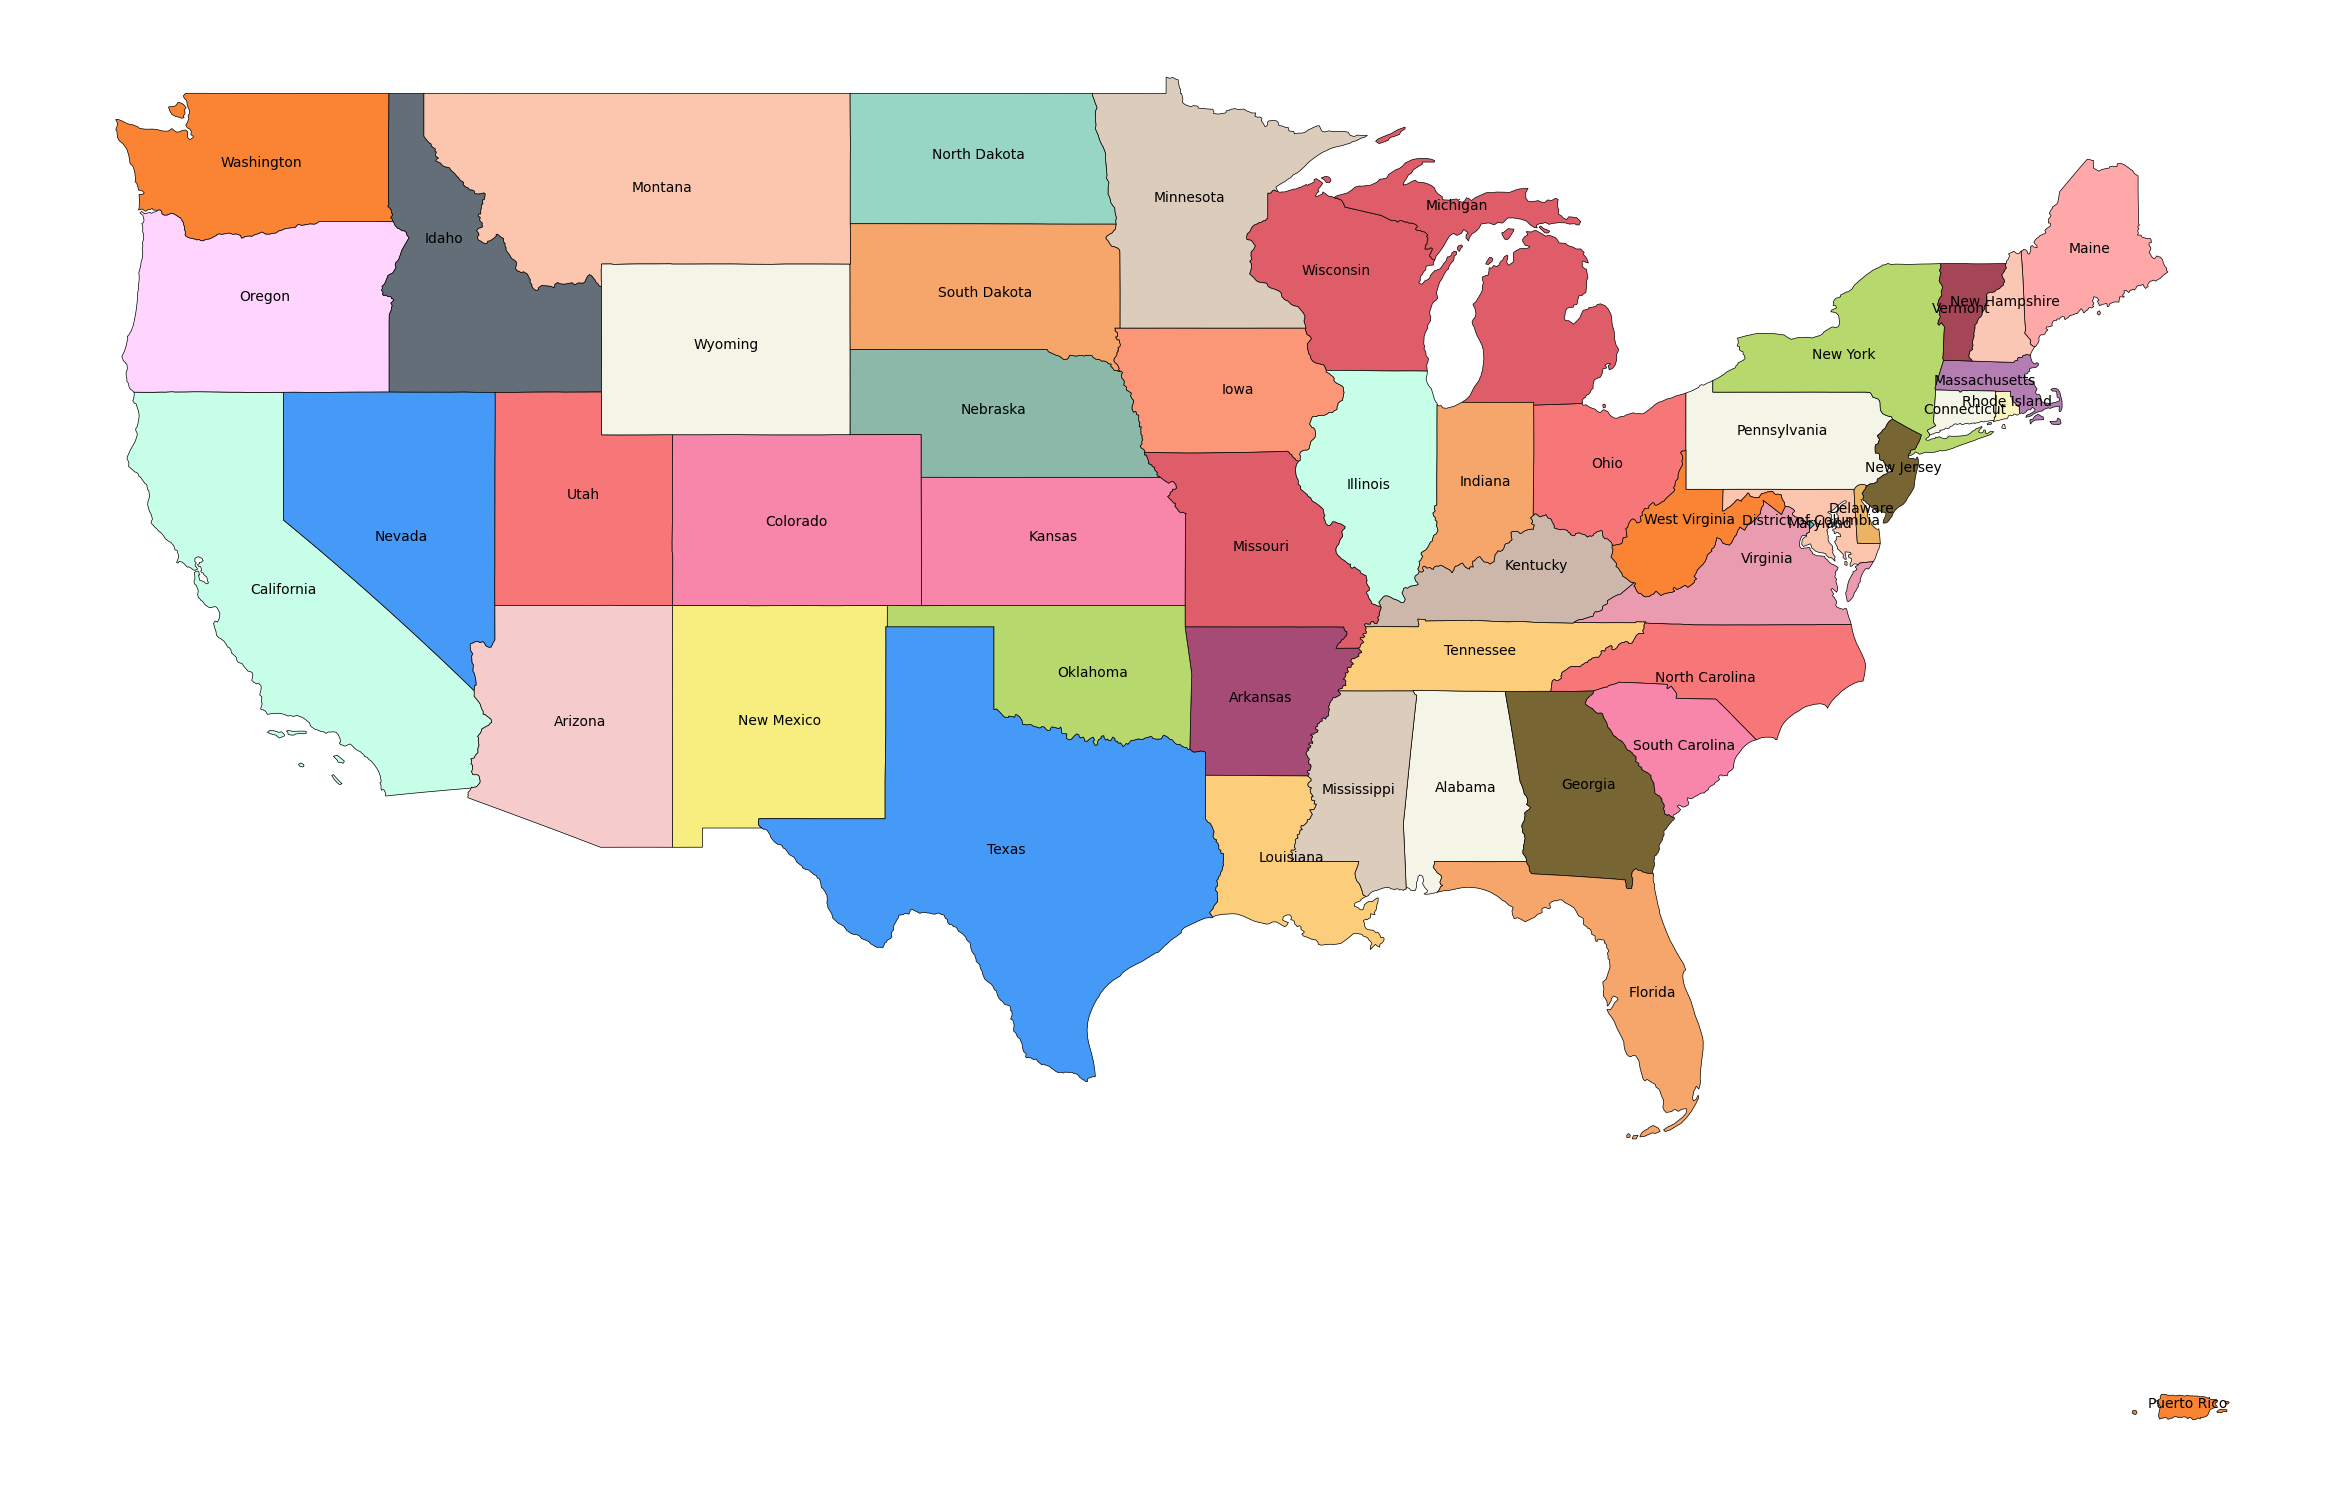
- randommap(data, title=None, title_kwds={}, figsize=(15, 15), facecolor='white', edgecolor='black', linewidth=0.5, seed=3, annot=False, annot_column=None, annot_align='center', annot_kwds={}, ax=None, axis_on=False, colors=colors, **geopandas_plot_kwds)
Fills the data with random colors. Ideal for generating political maps.
- Parameters:
data (GeoDataFrame) – GeoDataFrame for which the map must be plotted
title (str) – Title of the map. Defaults to None.
title_kwds (dict) – Keyword arguments to matplotlib.pyplot.title. Defaults to {}.
figsize (tuple) – Figure size. Defaults to (15, 15).
facecolor (str) – Figure’s face color. Defaults to “white”.
edgecolor (str) – Map’s edge color. Defaults to “black”.
linewidth (float) – Width of lines for shapes. Defaults to 0.5.
seed (int) – Seed for generating random colors. Defaults to 3.
annot (bool) – If True, annotations are generated. Defaults to False.
annot_column (str/GeoDataFrame column) – If annot is True, column should b passed as source for annotation. Defaults to None.
annot_align (str) – Text alignment for annotation. Defaults to “center”.
annot_kwds (dict) – Keyword arguments for annotation. Defaults to {}.
ax (matplotlib axis) – axis must be passed if plotting needs to be done on an existing axis. Defaults to None.
axis_on (bool) – If True, axes will be visible. Defaults to False.
colors (list/tuple) – List of colors to sample from. Defaults to a predefined set of colors.
**geopandas_plot_kwds – Geopandas plot keyword arguments
- Returns:
matplotlib axis object
- Return type:
ax
Examples
gsp.randommap(usa, seed=3, annot=True, annot_column="NAME", figsize=(30, 30))
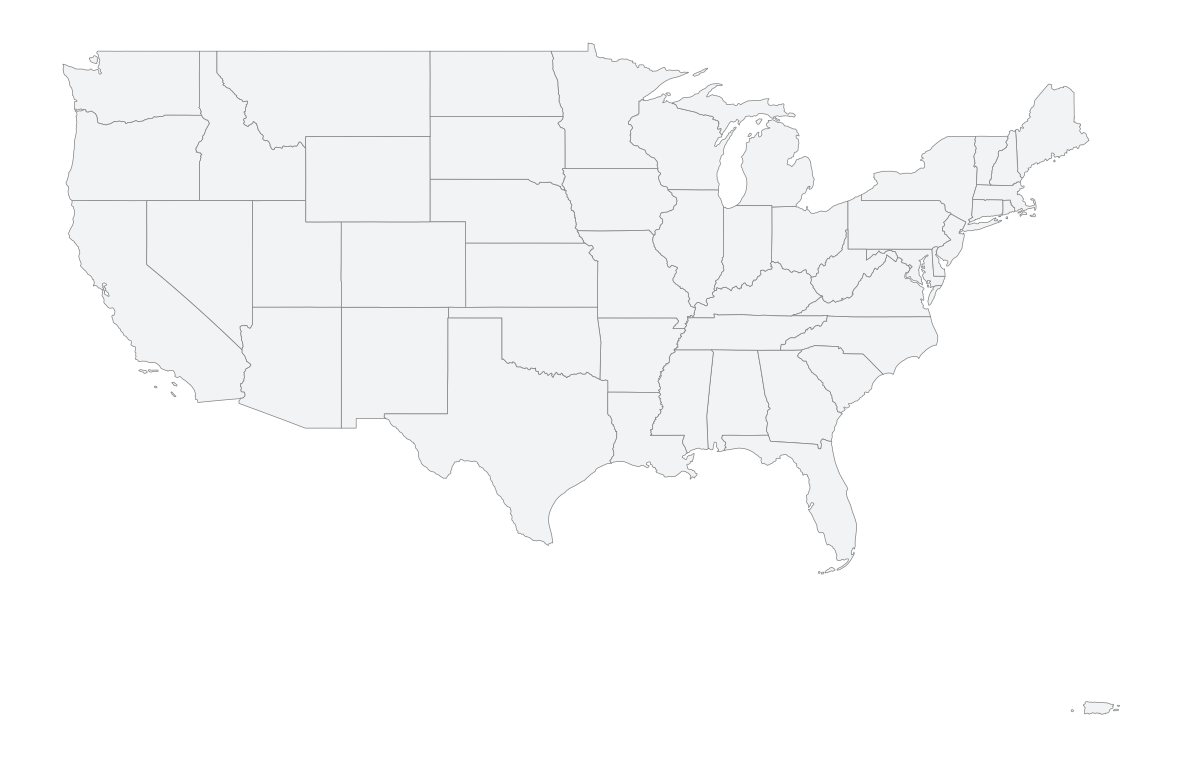
- shapeplot(data, title=None, title_kwds={}, figsize=(15, 15), facecolor='white', edgecolor='grey', linewidth=0.5, color='#F1F3F4', annot=False, annot_column=None, annot_align='center', annot_kwds={}, ax=None, axis_on=False, **geopandas_plot_kwds)
Plots GeoDataFrame shapes. replacement for geopandas plot’s default plot.
- Parameters:
data (GeoDataFrame) – GeoDataFrame for which the map must be plotted
title (str) – Title of the map. Defaults to None.
title_kwds (dict) – Keyword arguments to matplotlib.pyplot.title. Defaults to {}.
figsize (tuple) – Figure size. Defaults to (15, 15).
facecolor (str) – Figure’s face color. Defaults to “white”.
edgecolor (str) – Map’s edge color. Defaults to “black”.
linewidth (float) – Width of lines for shapes. Defaults to 0.5.
color (str) – Color of the shape. Defaults to “#F1F3F4”.
annot (bool) – If True, annotations are generated. Defaults to False.
annot_column (str/GeoDataFrame column) – If annot is True, column should b passed as source for annotation. Defaults to None.
annot_align (str) – Text alignment for annotation. Defaults to “center”.
annot_kwds (dict) – Keyword arguments for annotation. Defaults to {}.
ax (matplotlib axis) – axis must be passed if plotting needs to be done on an existing axis. Defaults to None.
axis_on (bool) – If True, axes will be visible. Defaults to False.
**geopandas_plot_kwds – Geopandas plot keyword arguments
- Returns:
matplotlib axis object
- Return type:
ax
Examples
gsp.shapeplot(usa, figsize=(15, 15))
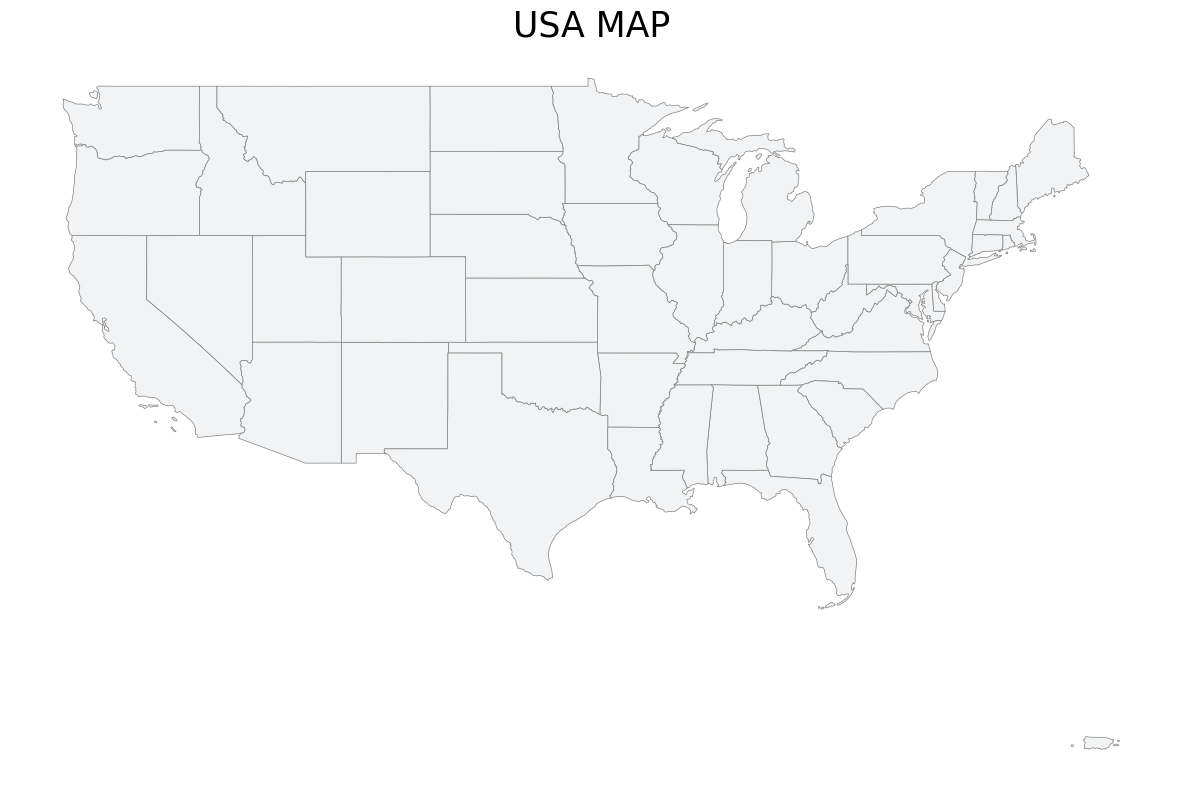
gsp.shapeplot(
    usa,
    title="USA MAP",
    title_kwds={"fontsize": 25, "fontname": "sans-serif", "fontweight": 3},
)
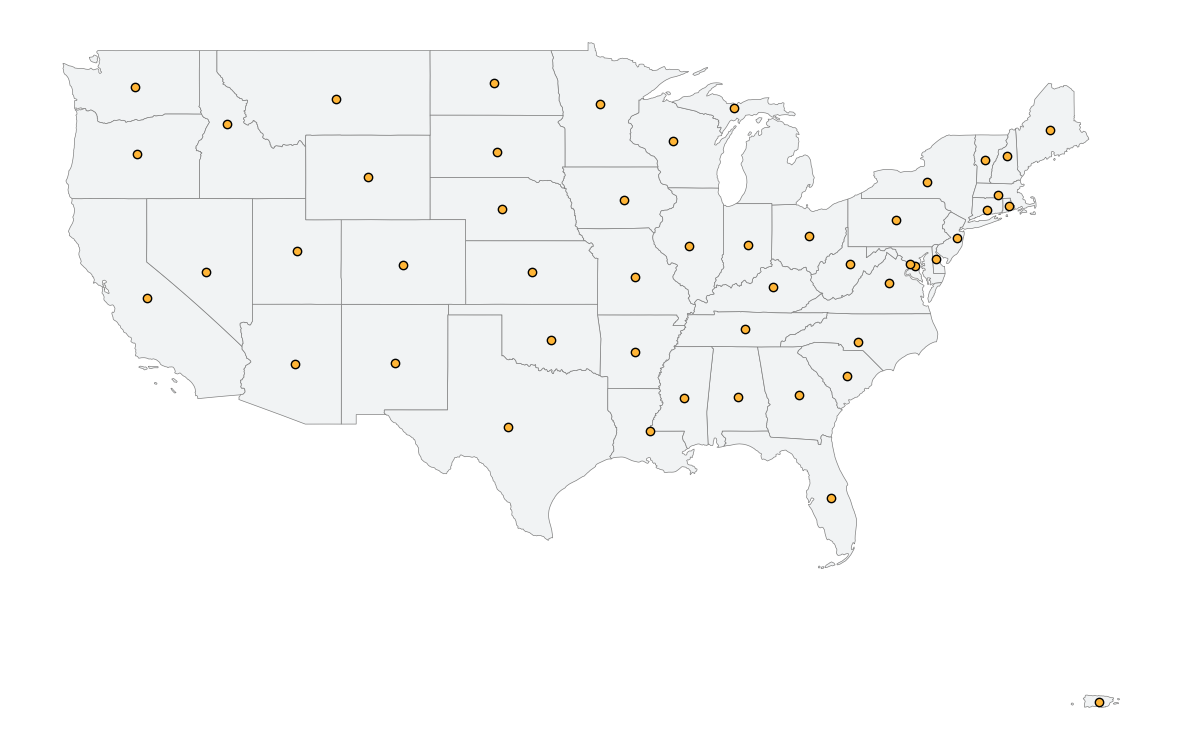
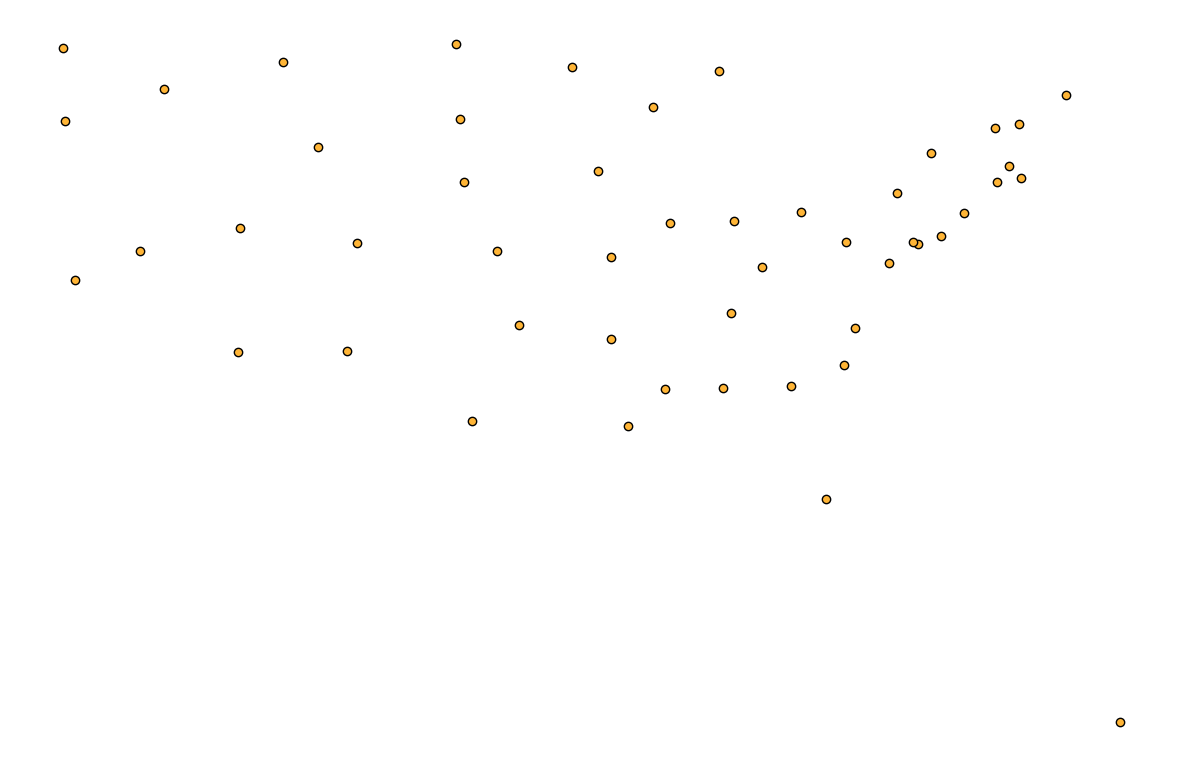
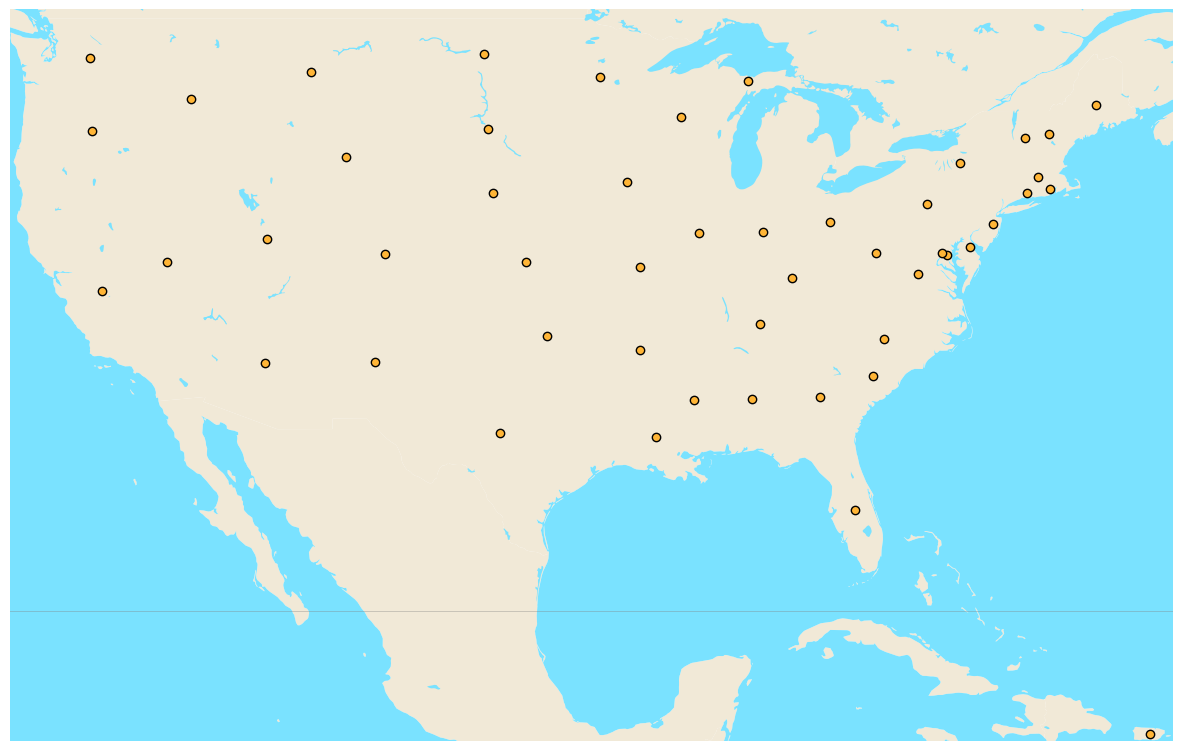
- pointplot(data, base=None, title=None, title_kwds={}, figsize=(15, 15), color='#ffb536', edgecolor='black', basecolor='#F1F3F4', baseboundarycolor='black', base_boundary=True, boundary_linewidth=0.5, linewidth=0.5, annot=False, annot_column=None, annot_align='center', annot_kwds={}, ax=None, axis_on=False, facecolor='white', **geopandas_plot_kwds)
Plots point data. Can plot it over another GeoDataFrame
- Parameters:
data (GeoDataFrame) – GeoDataFrame for which the map must be plotted
base (GeoDataFrame) – Base GeoDataFrame on top of which data must be plotted. Defaults to None.
title (str) – Title of the map. Defaults to None.
title_kwds (dict) – Keyword arguments to matplotlib.pyplot.title. Defaults to {}.
figsize (tuple) – Figure size. Defaults to (15, 15).
color (str) – Color of the point. Defaults to “#ffb536”.
edgecolor (str) – Map’s edge color. Defaults to “black”.
basecolor (str) – Color of the base data. Defaults to “#F1F3F4”.
baseboundarycolor (str) – Boundary color of the base data. Defaults to “black”.
base_boundary (bool) – If Base data boundaries should be visible. Defaults to True.
boundary_linewidth (float) – Linewidth of the base data boundaries. Defaults to 0.5.
linewidth (float) – Width of lines for shapes. Defaults to 0.5.
annot (bool) – If True, annotations are generated. Defaults to False.
annot_column (str/GeoDataFrame column) – If annot is True, column should b passed as source for annotation. Defaults to None.
annot_align (str) – Text alignment for annotation. Defaults to “center”.
annot_kwds (dict) – Keyword arguments for annotation. Defaults to {}.
ax (matplotlib axis) – axis must be passed if plotting needs to be done on an existing axis. Defaults to None.
axis_on (bool) – If True, axes will be visible. Defaults to False.
facecolor (str) – Figure’s face color. Defaults to “white”.
**geopandas_plot_kwds – Geopandas plot keyword arguments
- Returns:
matplotlib axis object
- Return type:
ax
Examples
gsp.pointplot(usa_points, base=usa)
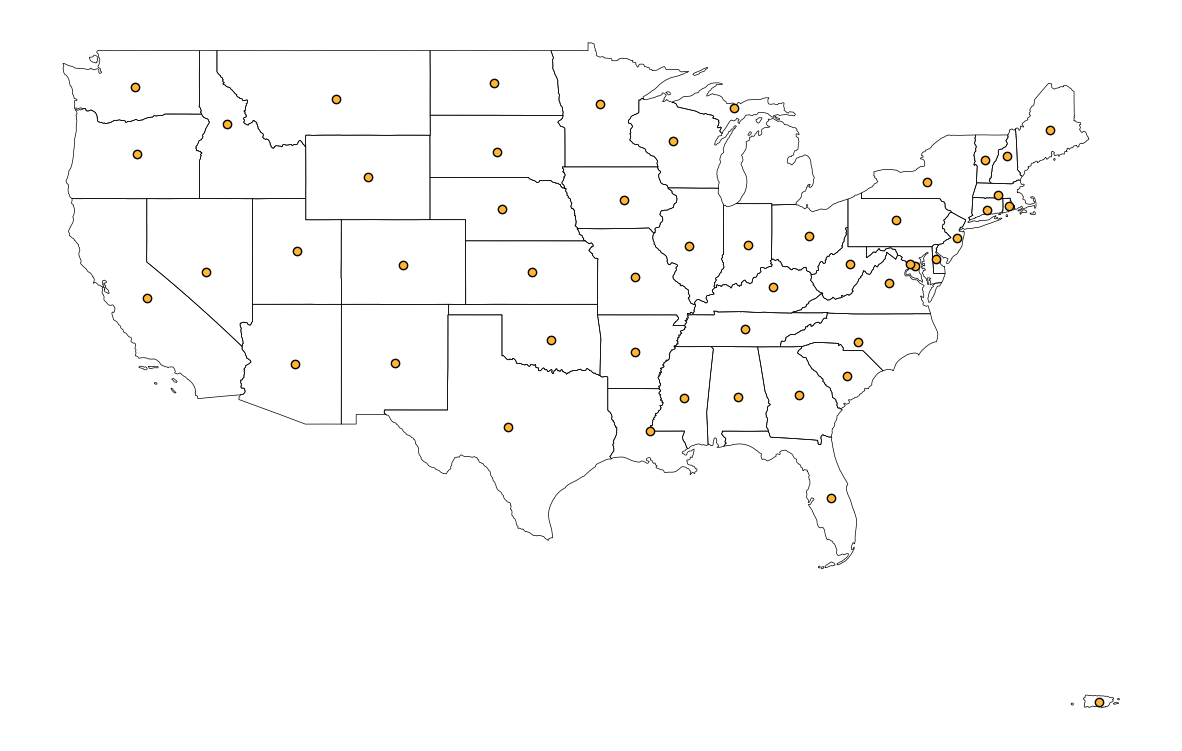
gsp.pointplot(usa_points, base=usa, base_boundary=False)
gsp.pointplot(usa_points)
ax = gsp.shapeplot(usa, figsize=(15, 15))
gsp.pointplot(usa_points, ax=ax)

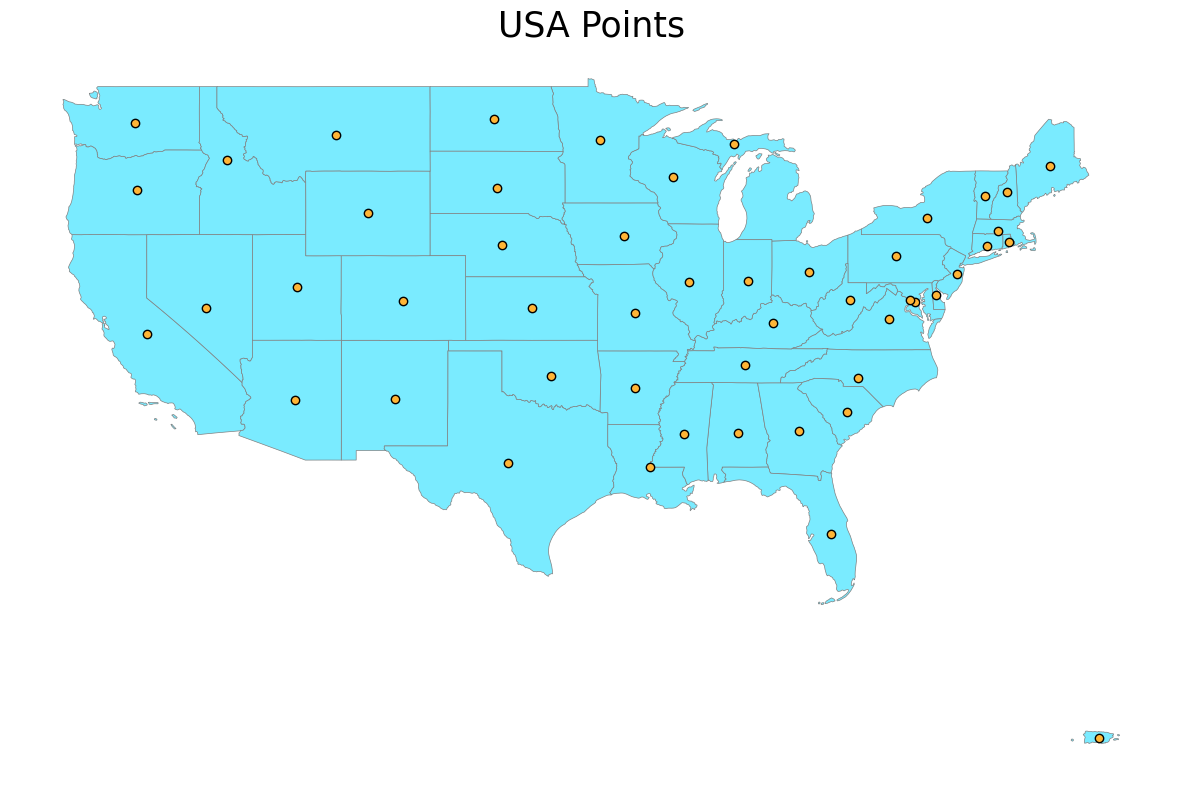
gsp.pointplot(
    usa_points,
    base=usa,
    basecolor="#7aebff",
    base_boundary=False,
    title="USA Points",
    title_kwds={"fontsize": 25, "fontname": "sans-serif", "fontweight": 3},
)
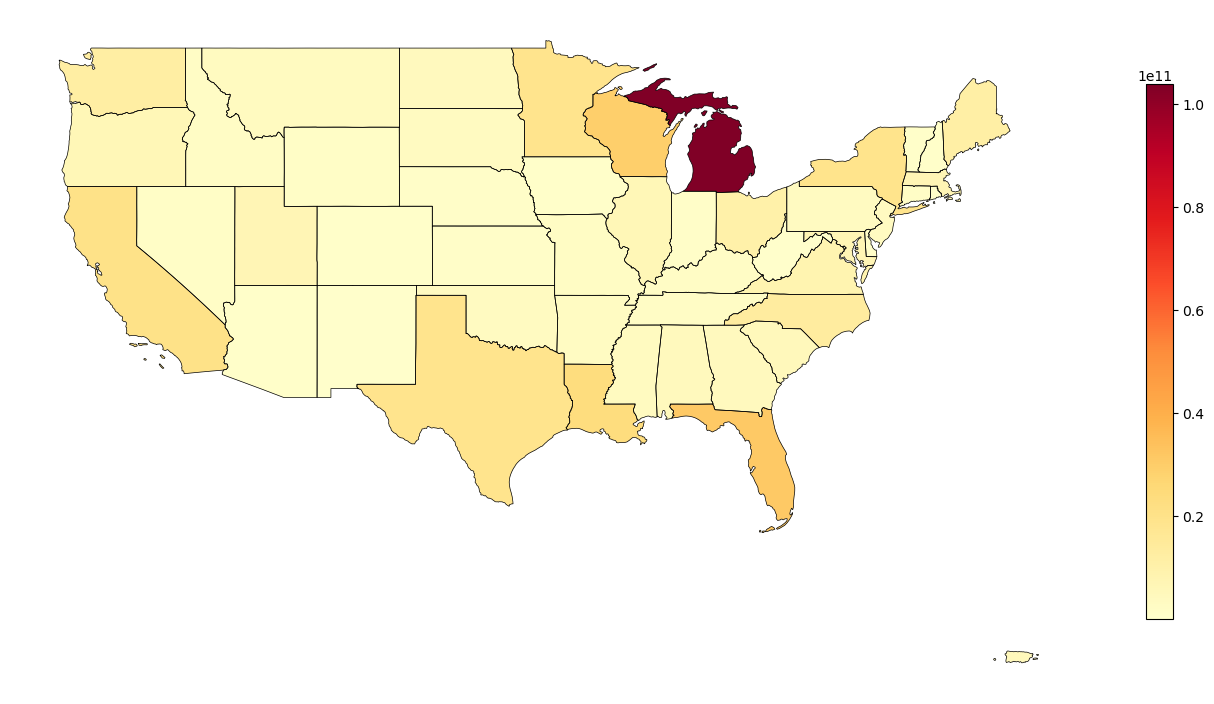
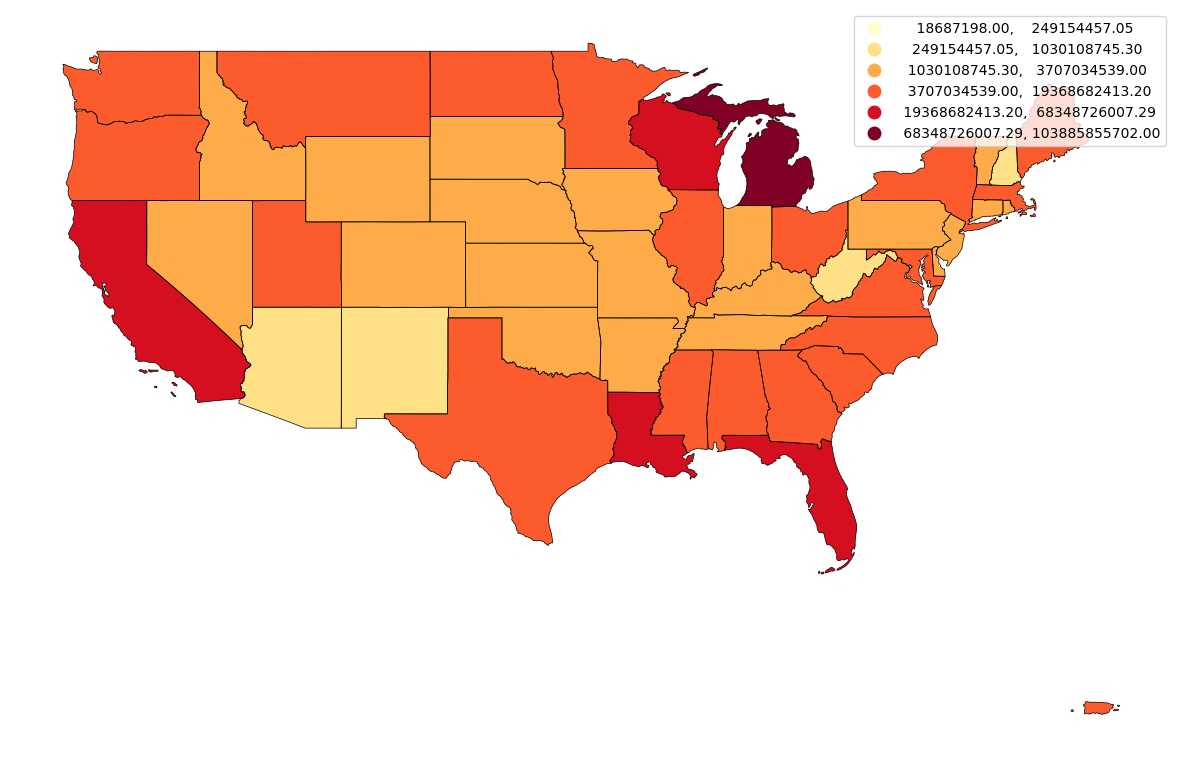
- choropleth(data, column, title=None, title_kwds={}, figsize=(15, 15), cmap='YlOrRd', facecolor='white', scheme='percentiles', boundarycolor='black', boundary_linewidth=0.5, legend=True, annot=False, annot_column=None, annot_align='center', annot_kwds={}, ax=None, axis_on=False, **geopandas_plot_kwds)
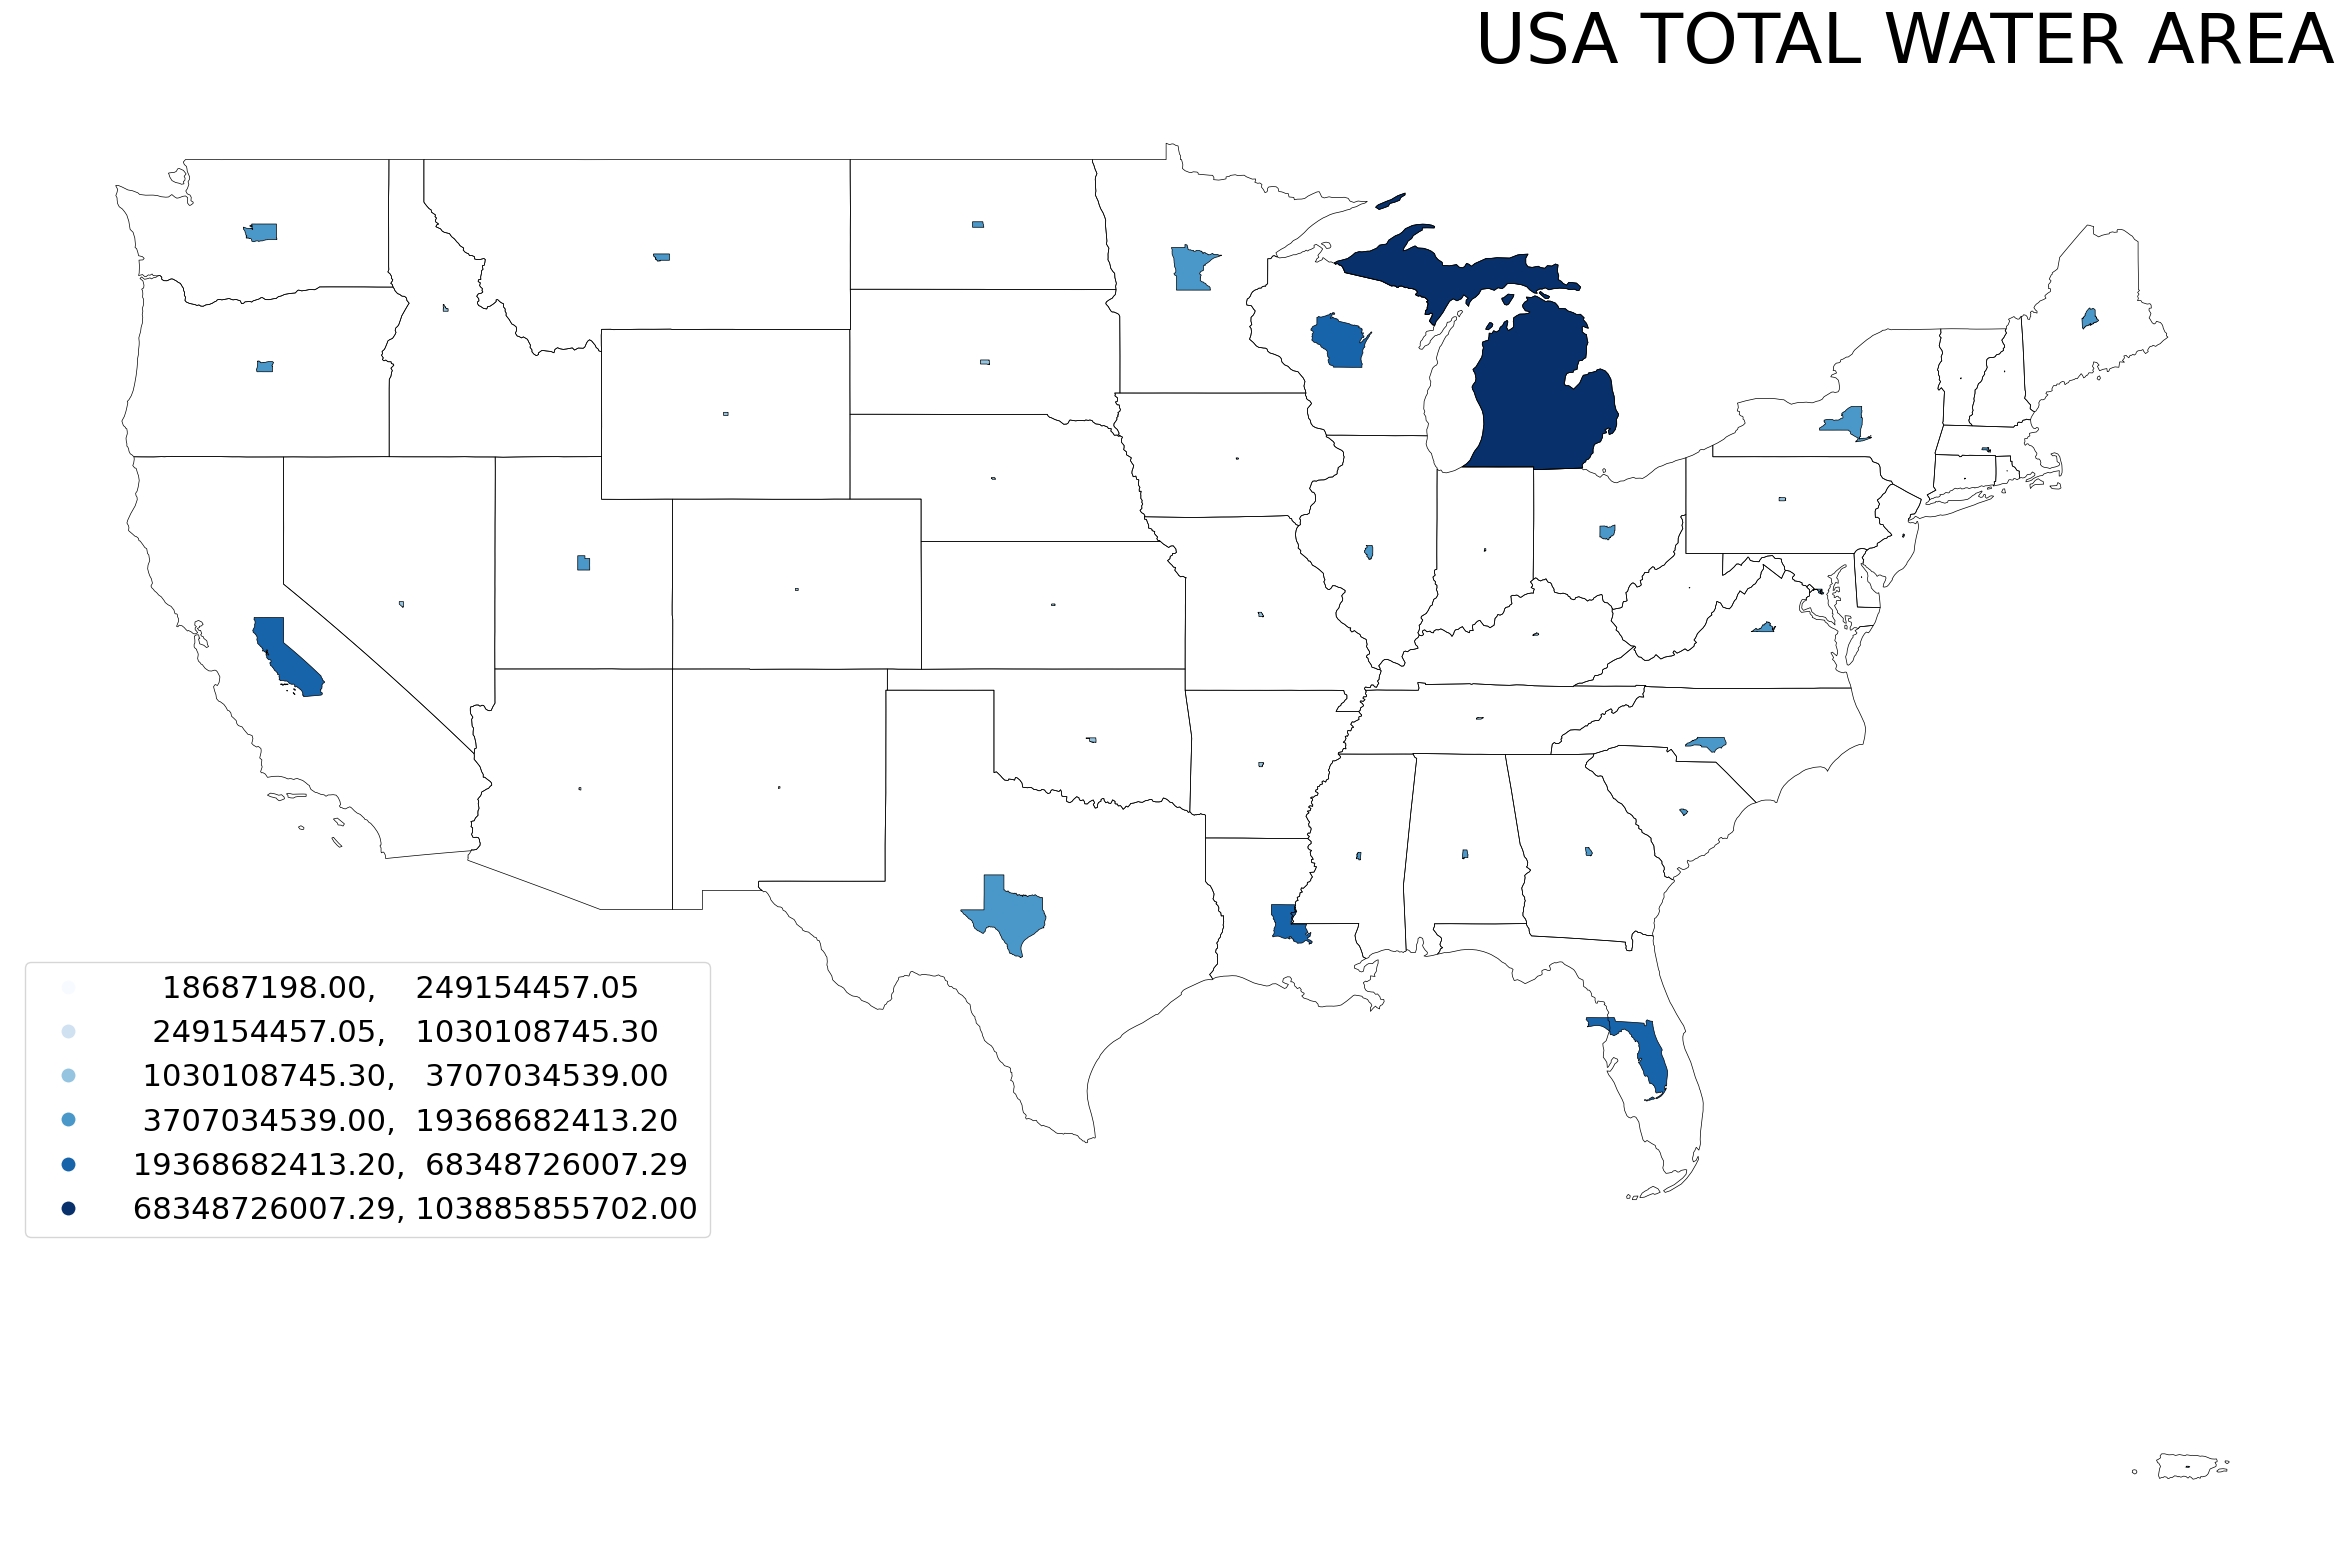
Generates Choropleth Map. Replacement for geopandas plot with a column passed in arguments.
- Parameters:
data (GeoDataFrame) – GeoDataFrame for which the map must be plotted
column (str/GeoDataFrame column) – Column for which choropleth map should be plotted
title (str) – Title of the map. Defaults to None.
title_kwds (dict) – Keyword arguments to matplotlib.pyplot.title. Defaults to {}.
figsize (tuple) – Figure size. Defaults to (15, 15).
cmap (str) – Colormap for the plot. Defaults to “YlOrRd”.
facecolor (str) – Figure’s face color. Defaults to “white”.
scheme (str) – mapclassify scheme for assigning colors. Defaults to “percentiles”.
boundarycolor (str) – Map’s boundary color. Defaults to “black”.
boundary_linewidth (float) – Linewidth of boundaries. Defaults to 0.5.
legend (bool) – If True, legend is displayed. Defaults to True.
annot (bool) – If True, annotations are generated. Defaults to False.
annot_column (str/GeoDataFrame column) – If annot is True, column should b passed as source for annotation. Defaults to None.
annot_align (str) – Text alignment for annotation. Defaults to “center”.
annot_kwds (dict) – Keyword arguments for annotation. Defaults to {}.
ax (matplotlib axis) – axis must be passed if plotting needs to be done on an existing axis. Defaults to None.
axis_on (bool) – If True, axes will be visible. Defaults to False.
**geopandas_plot_kwds – Geopandas plot keyword arguments
- Returns:
matplotlib axis object
- Return type:
ax
Examples
gsp.choropleth(usa, "AWATER")

gsp.choropleth(
    usa,
    "AWATER",
    scheme=None,
    legend_kwds={"shrink": 0.5},
)
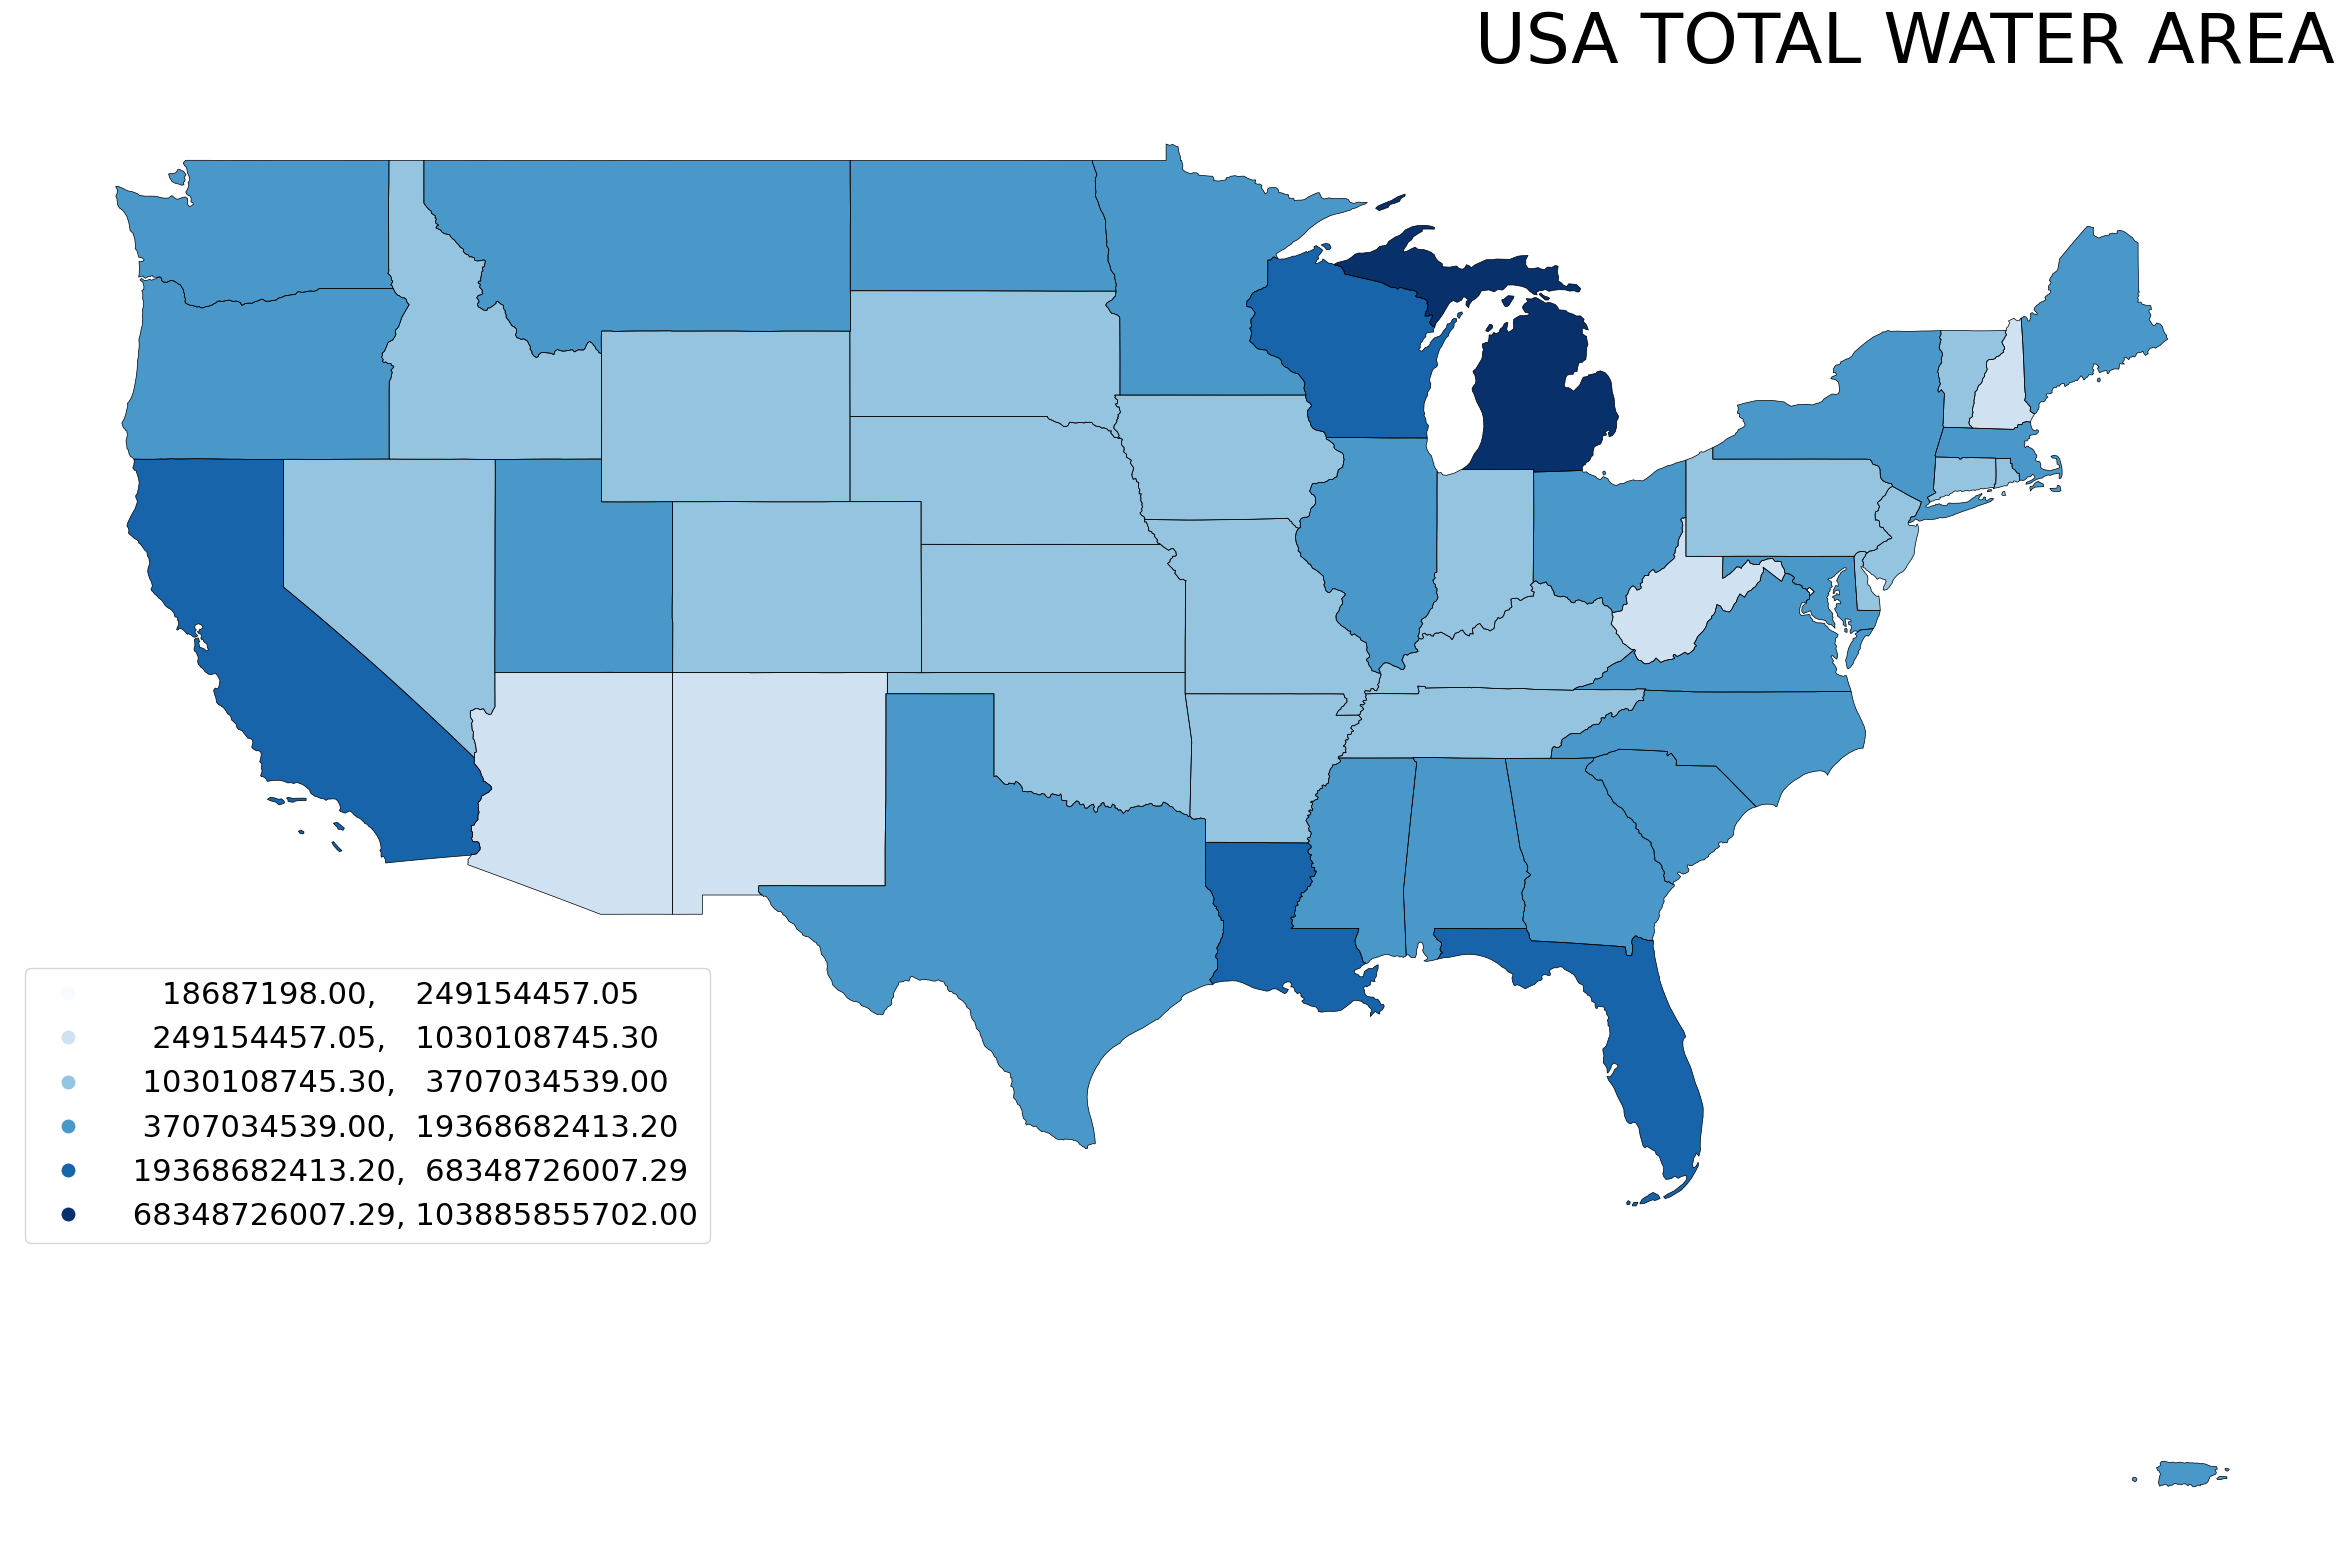
gsp.choropleth(
    usa,
    "AWATER",
    cmap="Blues",
    figsize=(30, 30),
    legend_kwds={"loc": "lower left", "bbox_to_anchor": (0, 0.2), "prop": {"size": 22}},
    title="USA TOTAL WATER AREA",
    title_kwds={
        "fontsize": 50,
        "fontname": "sans-serif",
        "fontweight": 3,
        "loc": "right",
    },
)
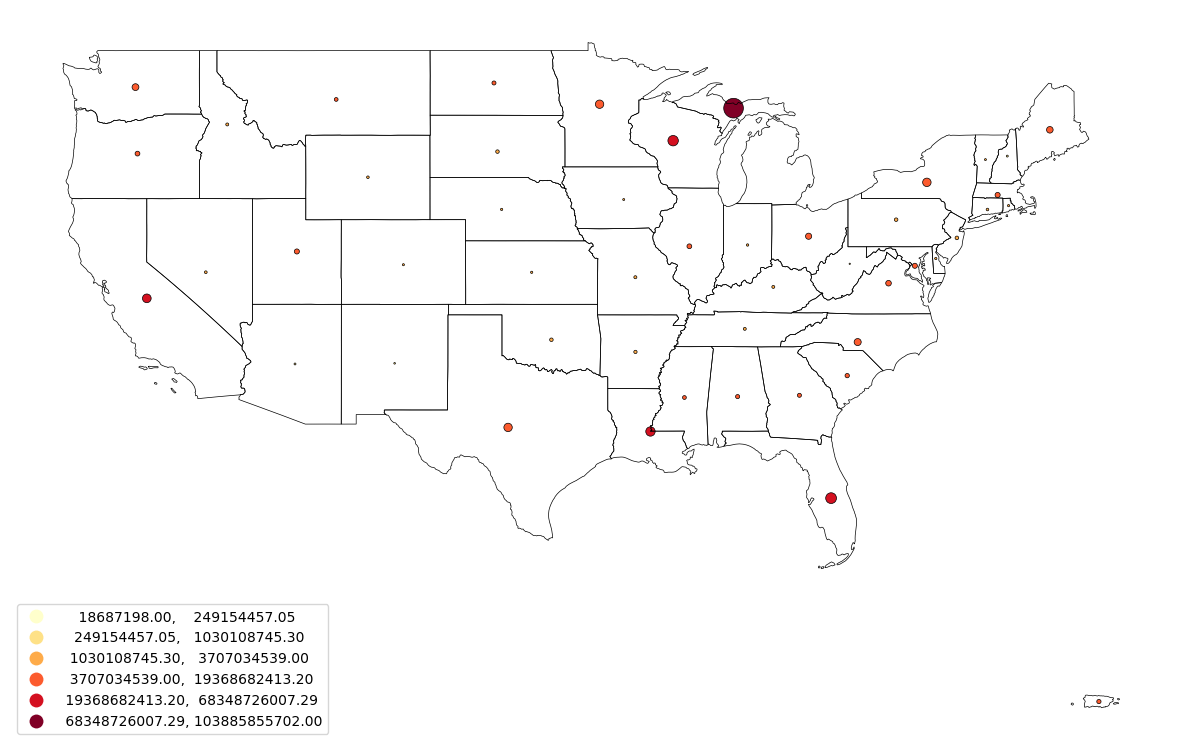
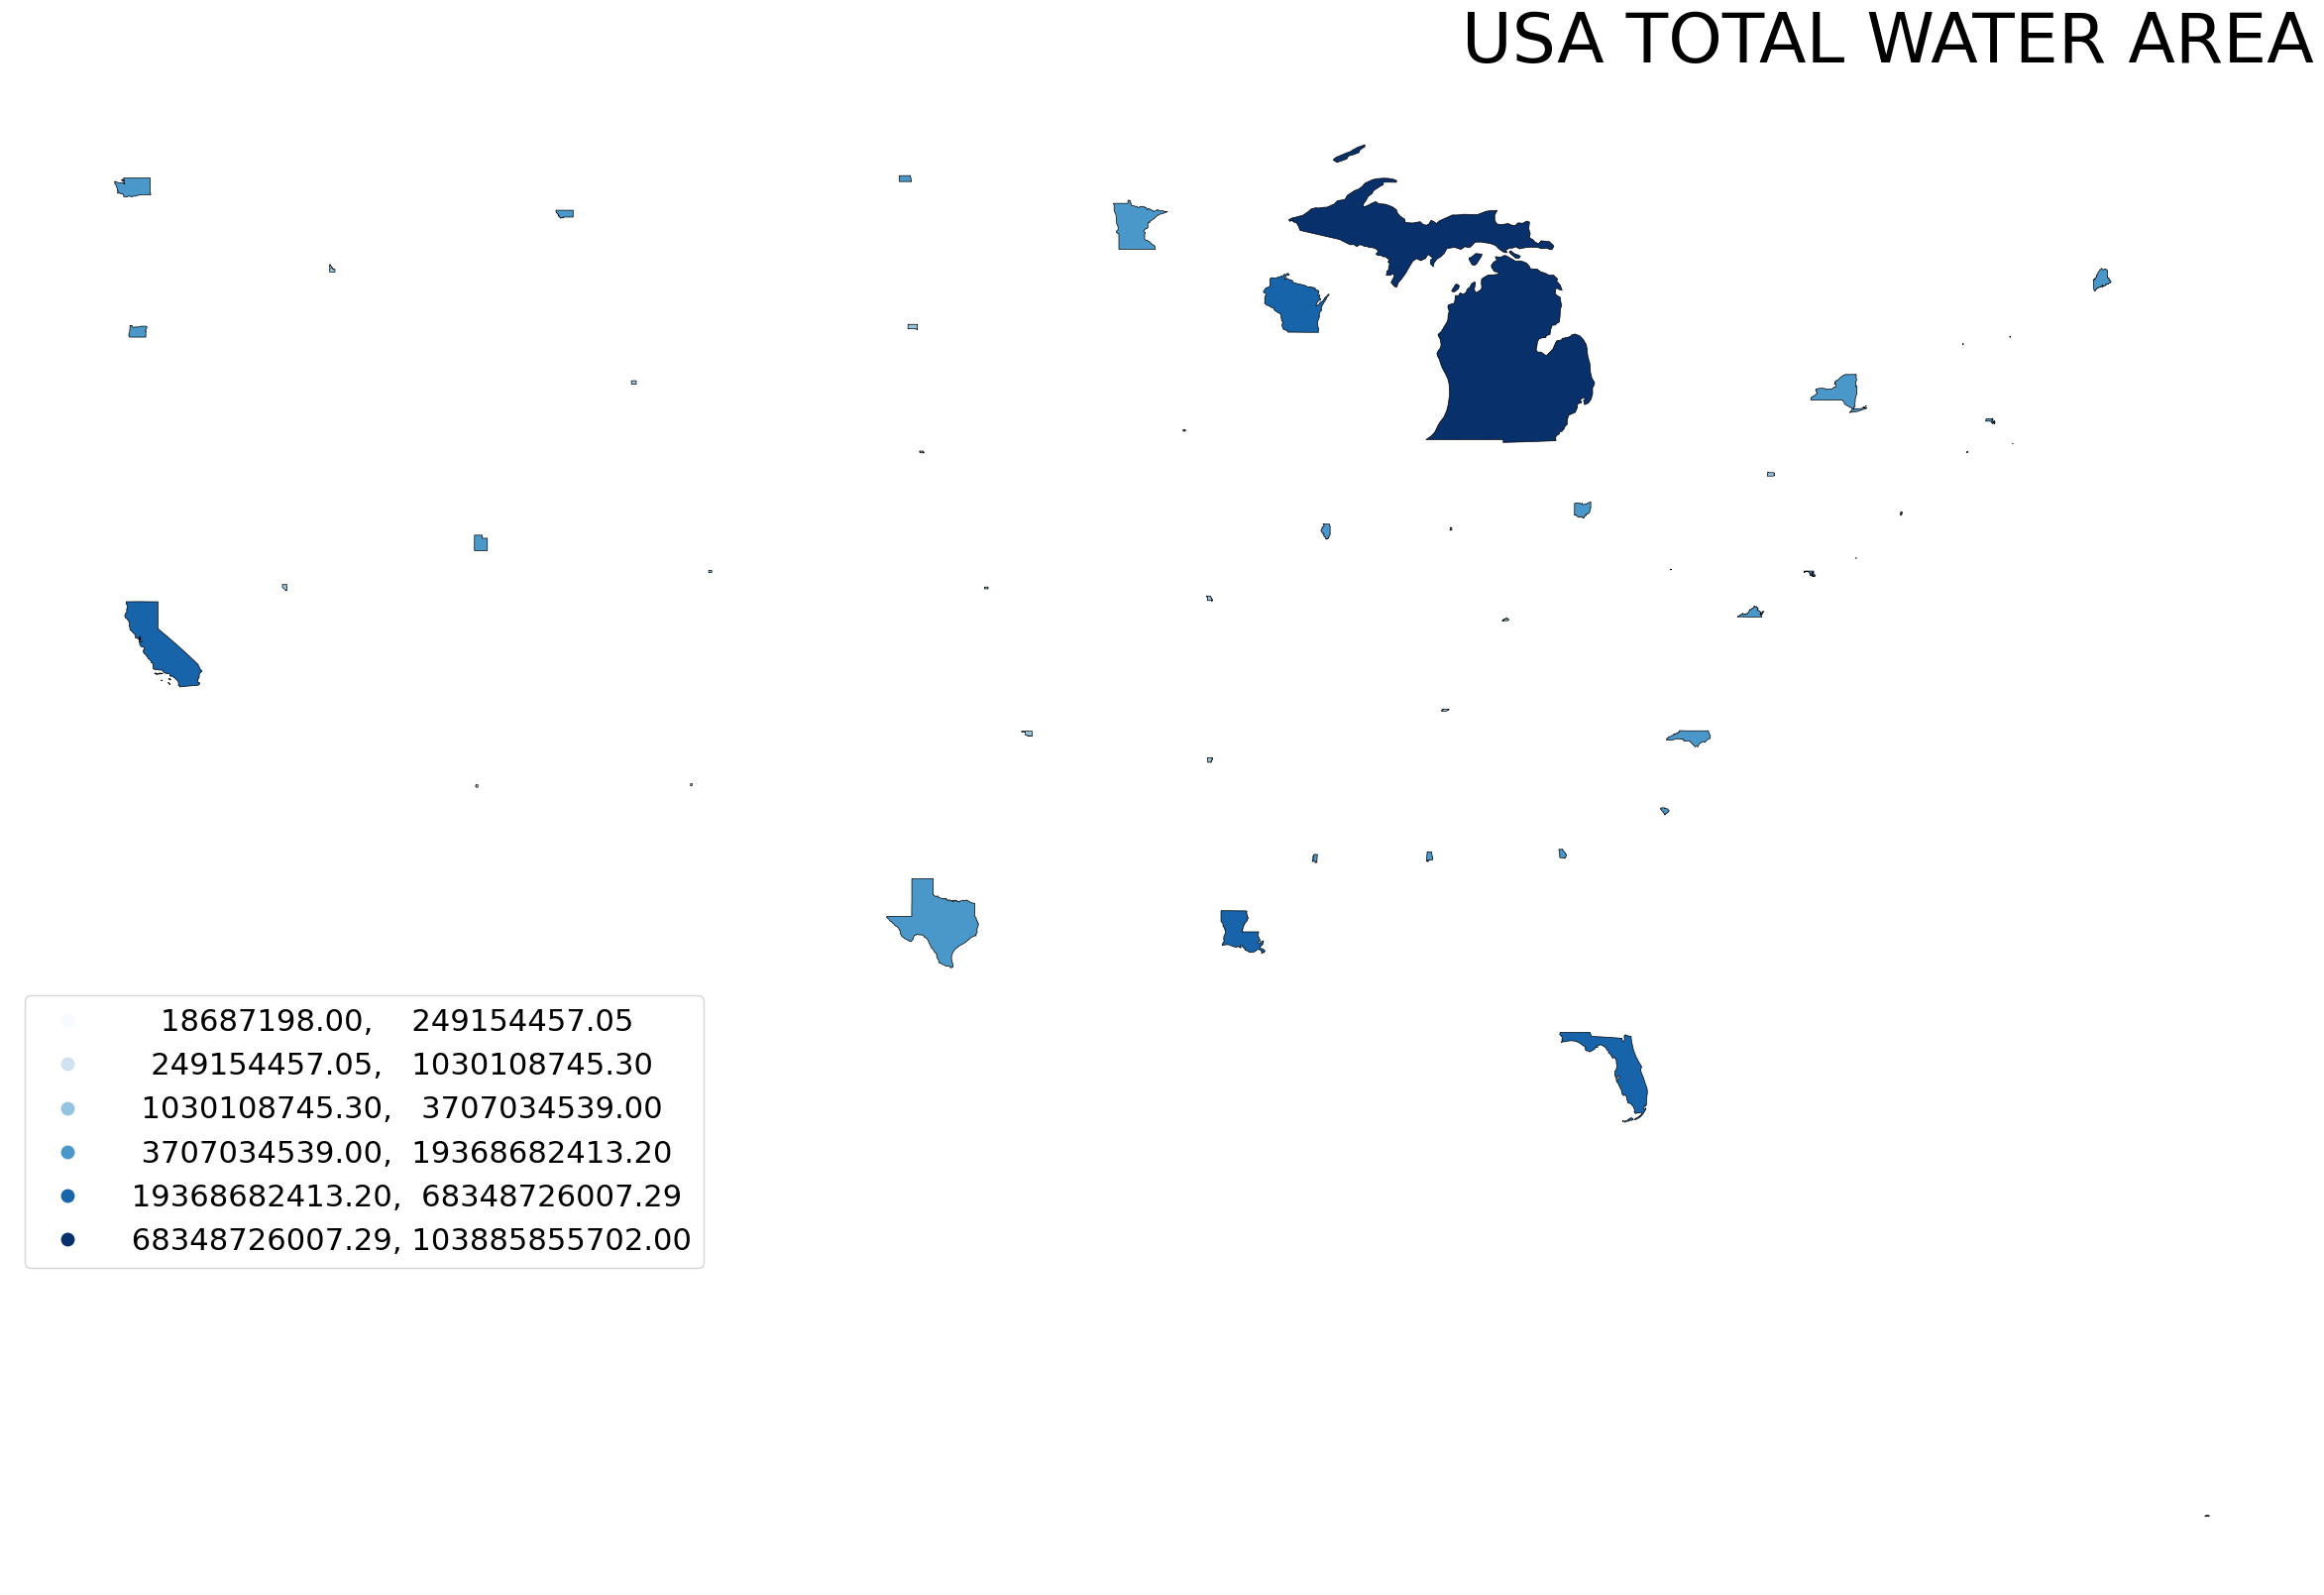
- bubblemap(data, column, base=None, basecolor='#F1F3F4', baseboundarycolor='black', base_boundary=True, point_data=False, scale_factor=200, title=None, title_kwds={}, figsize=(15, 15), linewidth=0.5, cmap='YlOrRd', edgecolor='black', facecolor='white', scheme='percentiles', boundarycolor='black', boundary_linewidth=0.5, legend=True, annot=False, annot_column=None, annot_align='center', annot_kwds={}, ax=None, axis_on=False, **geopandas_plot_kwds)
Plots a bubble map.
- Parameters:
data (GeoDataFrame) – GeoDataFrame for which the map must be plotted
column (str/GeoDataFrame column) – Column for which the plot should be plotted
base (GeoDataFrame) – Base GeoDataFrame on top of which data must be plotted. Defaults to None.
basecolor (str) – Color of the base data. Defaults to “#F1F3F4”.
baseboundarycolor (str) – Boundary color of the base data. Defaults to “black”.
base_boundary (bool) – If Base data boundaries should be visible. Defaults to True.
point_data (bool) – Must be true if the type of data being mapped is point shape. Defaults to False.
scale_factor (int) – Scales the bubbles, higher scale factor means larger the bubble. Defaults to 200.
title (str) – Title of the map. Defaults to None.
title_kwds (dict) – Keyword arguments to matplotlib.pyplot.title. Defaults to {}.
figsize (tuple) – Figure size. Defaults to (15, 15).
linewidth (float) – Width of lines for shapes. Defaults to 0.5.
cmap (str) – Colormap for the plot. Defaults to “YlOrRd”.
edgecolor (str) – Map’s edge color. Defaults to “black”.
facecolor (str) – Figure’s face color. Defaults to “white”.
scheme (str) – mapclassify scheme for assigning colors. Defaults to “percentiles”.
boundarycolor (str) – Map’s boundary color. Defaults to “black”.
boundary_linewidth (float) – Linewidth of boundaries. Defaults to 0.5.
legend (bool) – If True, legend is displayed. Defaults to True.
annot (bool) – If True, annotations are generated. Defaults to False.
annot_column (str/GeoDataFrame column) – If annot is True, column should b passed as source for annotation. Defaults to None.
annot_align (str) – Text alignment for annotation. Defaults to “center”.
annot_kwds (dict) – Keyword arguments for annotation. Defaults to {}.
ax (matplotlib axis) – axis must be passed if plotting needs to be done on an existing axis. Defaults to None.
axis_on (bool) – If True, axes will be visible. Defaults to False.
**geopandas_plot_kwds – Geopandas plot keyword arguments
- Returns:
matplotlib axis object
- Return type:
ax
Examples
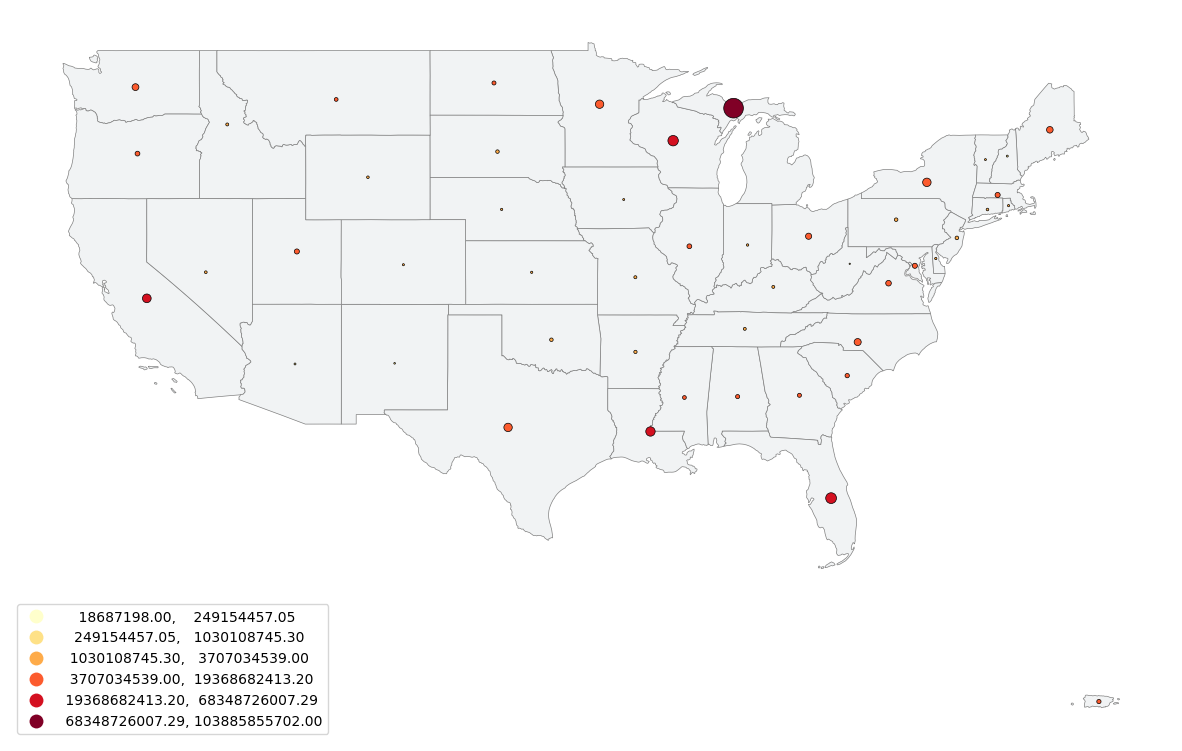
gsp.bubblemap(usa, usa["AWATER"])
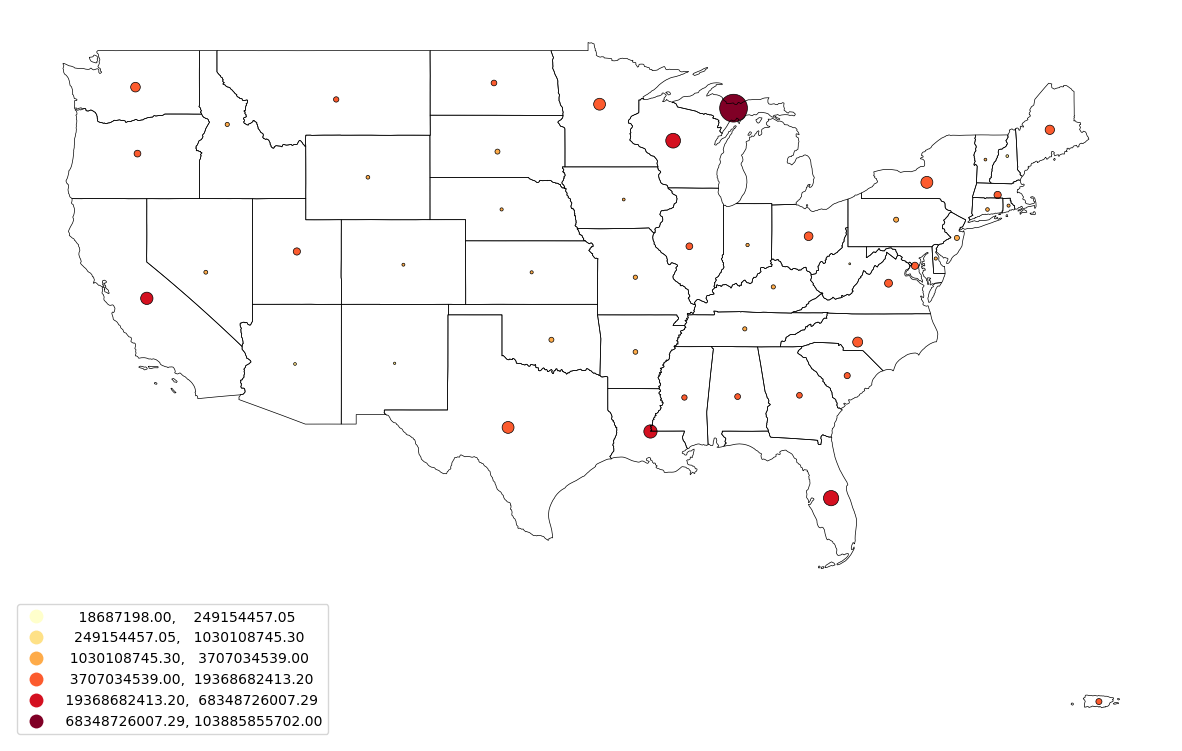
gsp.bubblemap(usa, usa["AWATER"], scale_factor=400)
gsp.bubblemap(usa_pts, "AWATER", point_data=True)
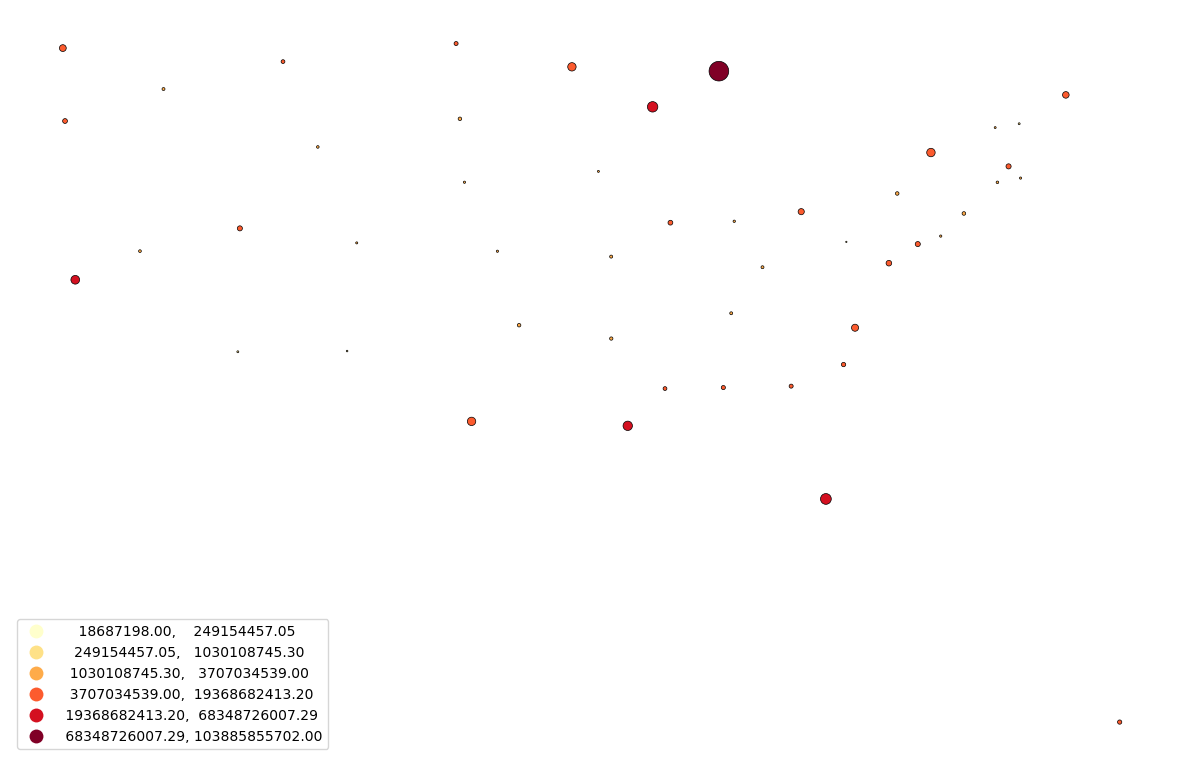
gsp.bubblemap(usa_pts, "AWATER", base=usa, base_boundary=False, point_data=True)
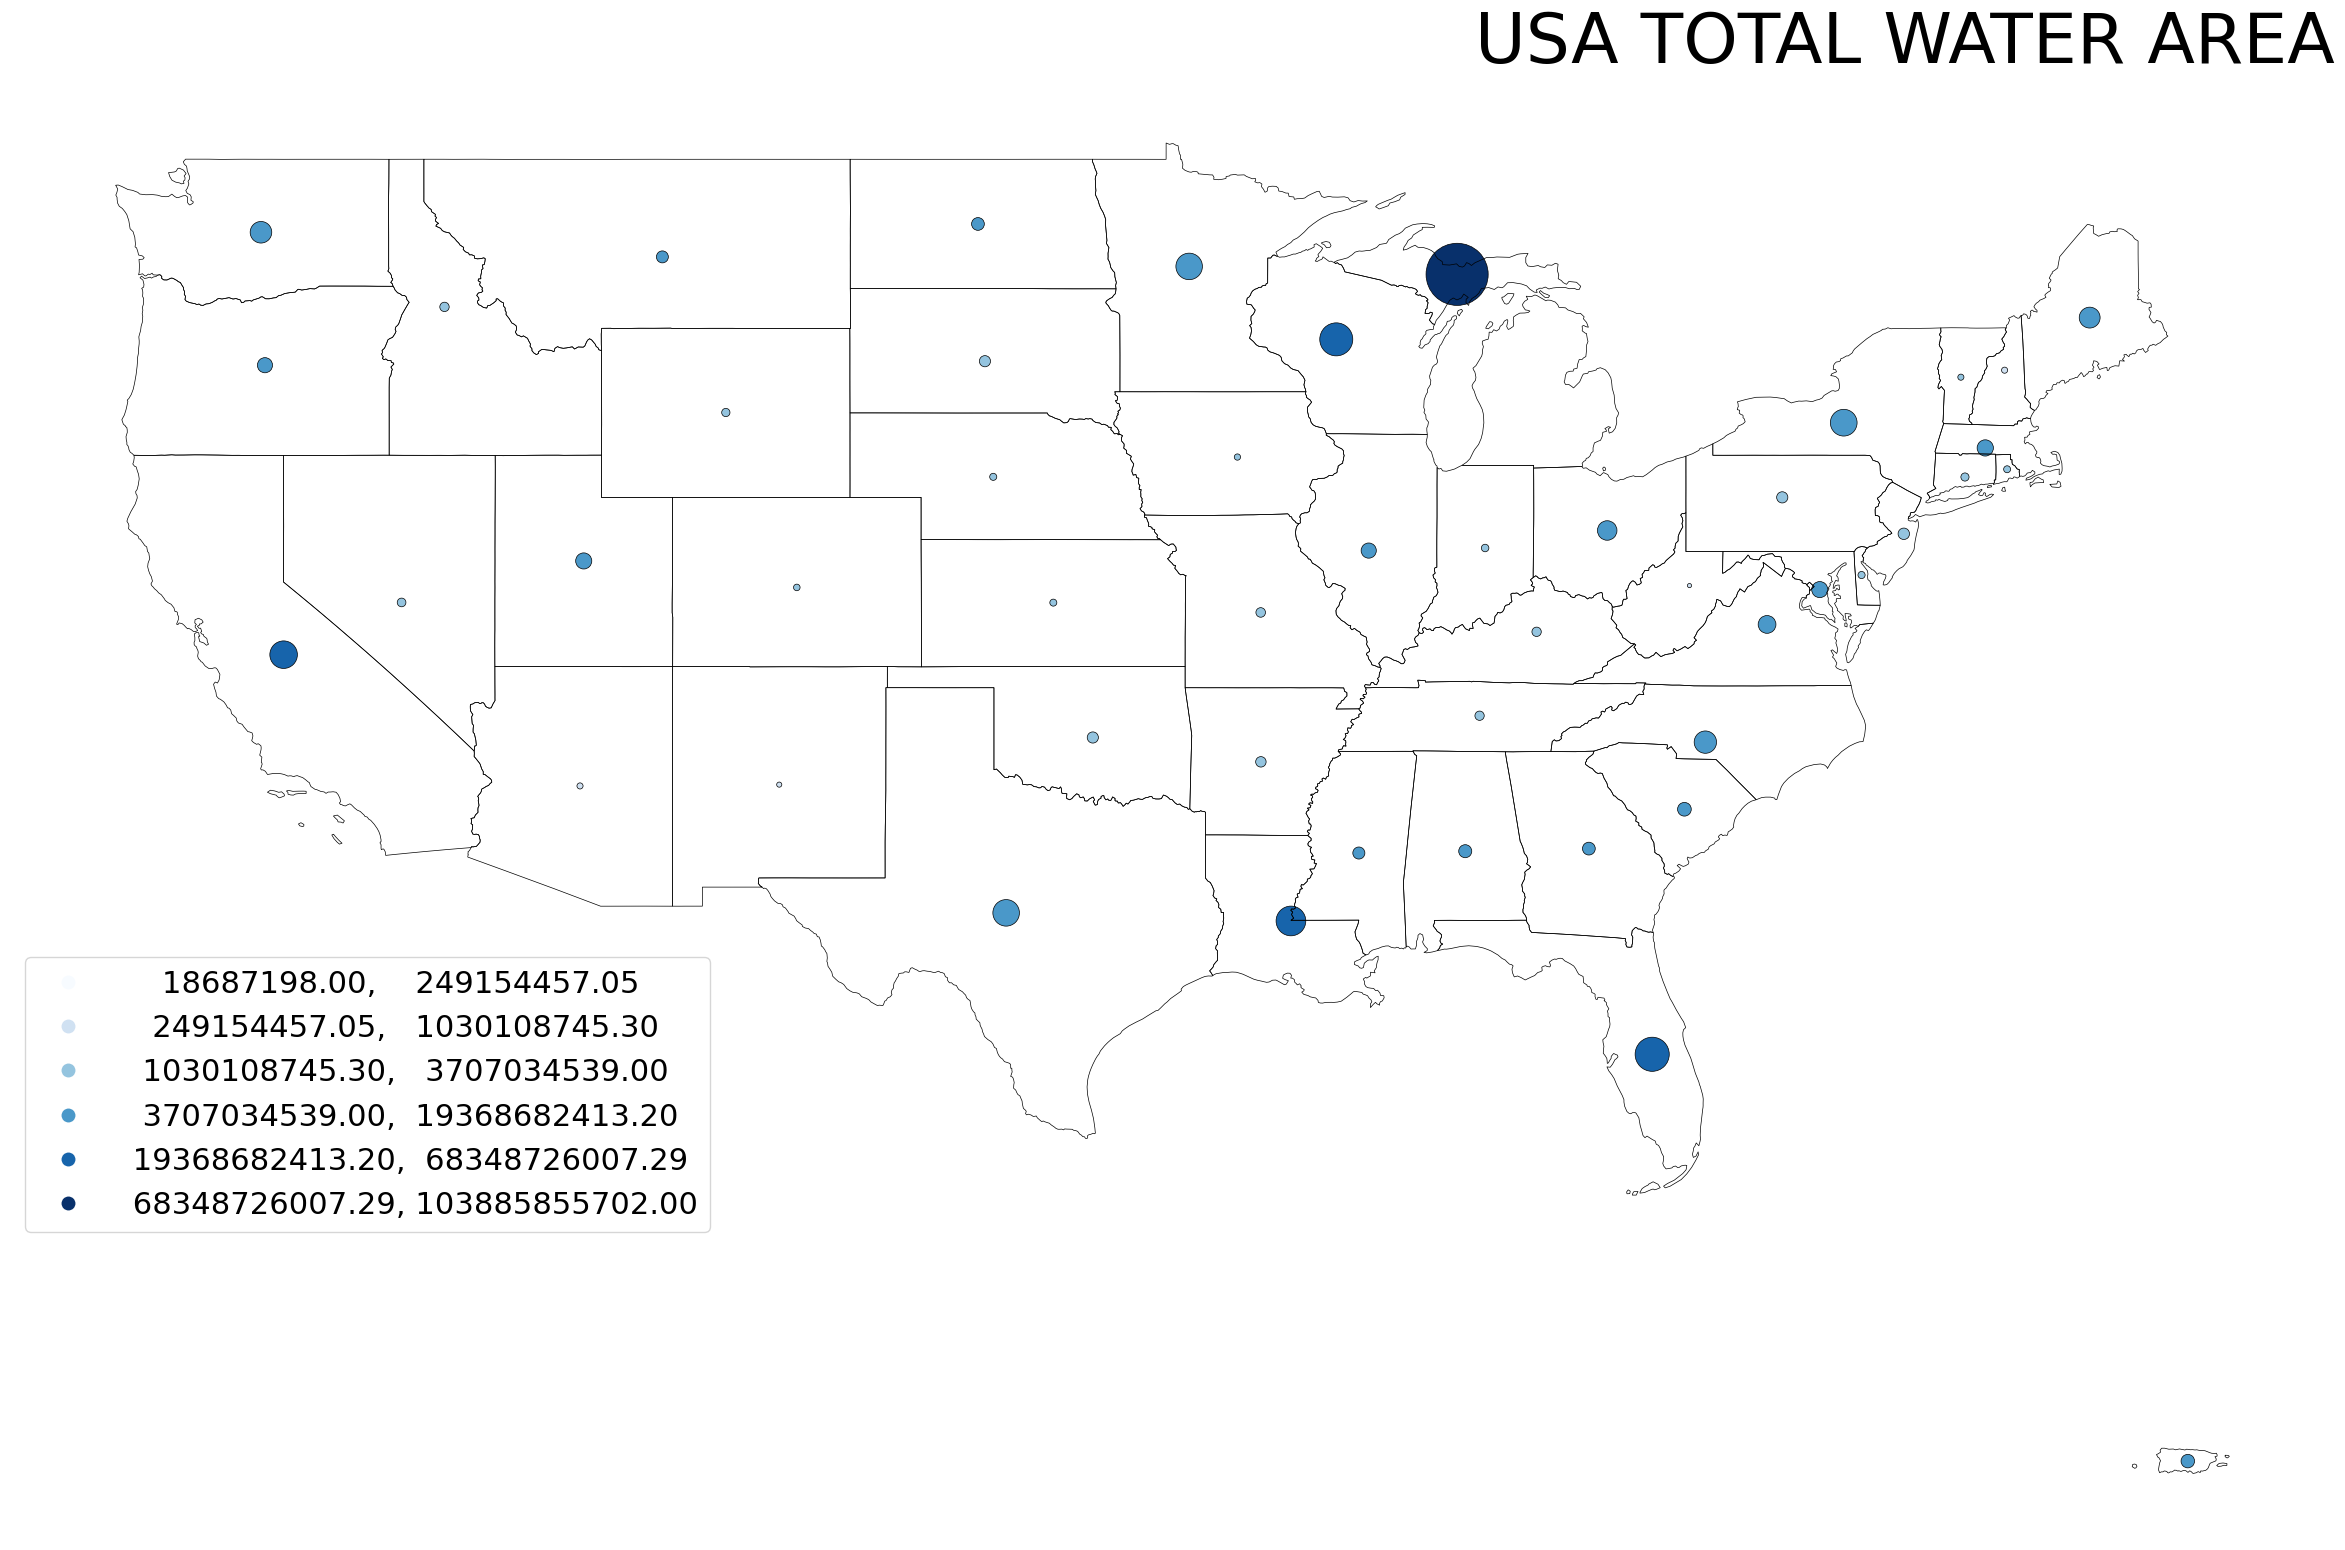
gsp.bubblemap(
    usa,
    usa["AWATER"],
    cmap="Blues",
    figsize=(30, 30),
    legend_kwds={"loc": "lower left", "bbox_to_anchor": (0, 0.2), "prop": {"size": 22}},
    title="USA TOTAL WATER AREA",
    title_kwds={
        "fontsize": 50,
        "fontname": "sans-serif",
        "fontweight": 3,
        "loc": "right",
    },
    scale_factor=2000,
)
- cartogram(data, column, basecolor='#F1F3F4', base_boundary=True, cartogram_only=False, title=None, title_kwds={}, figsize=(15, 15), linewidth=0.5, cmap='YlOrRd', edgecolor='black', facecolor='white', scheme='percentiles', boundarycolor='black', boundary_linewidth=0.5, legend=True, annot=False, annot_column=None, annot_align='center', annot_kwds={}, ax=None, axis_on=False, **geopandas_plot_kwds)
Plots a cartogram
- Parameters:
data (GeoDataFrame) – GeoDataFrame for which the map must be plotted
column (str/GeoDataFrame column) – Column for which the plot should be plotted
basecolor (str) – Color of the base data. Defaults to “#F1F3F4”.
base_boundary (bool) – If Base data boundaries should be visible. Defaults to True.
cartogram_only (bool) – If True, function returns cartogram without base data. Defaults to False.
title (str) – Title of the map. Defaults to None.
title_kwds (dict) – Keyword arguments to matplotlib.pyplot.title. Defaults to {}.
figsize (tuple) – Figure size. Defaults to (15, 15).
linewidth (float) – Width of lines for shapes. Defaults to 0.5.
cmap (str) – Colormap for the plot. Defaults to “YlOrRd”.
edgecolor (str) – Map’s edge color. Defaults to “black”.
facecolor (str) – Figure’s face color. Defaults to “white”.
scheme (str) – mapclassify scheme for assigning colors. Defaults to “percentiles”.
boundarycolor (str) – Map’s boundary color. Defaults to “black”.
boundary_linewidth (float) – Linewidth of boundaries. Defaults to 0.5.
legend (bool) – If True, legend is displayed. Defaults to True.
annot (bool) – If True, annotations are generated. Defaults to False.
annot_column (str/GeoDataFrame column) – If annot is True, column should b passed as source for annotation. Defaults to None.
annot_align (str) – Text alignment for annotation. Defaults to “center”.
annot_kwds (dict) – Keyword arguments for annotation. Defaults to {}.
ax (matplotlib axis) – axis must be passed if plotting needs to be done on an existing axis. Defaults to None.
axis_on (bool) – If True, axes will be visible. Defaults to False.
**geopandas_plot_kwds – Geopandas plot keyword arguments
- Returns:
matplotlib axis object
- Return type:
ax
Examples
gsp.cartogram(usa,"AWATER")
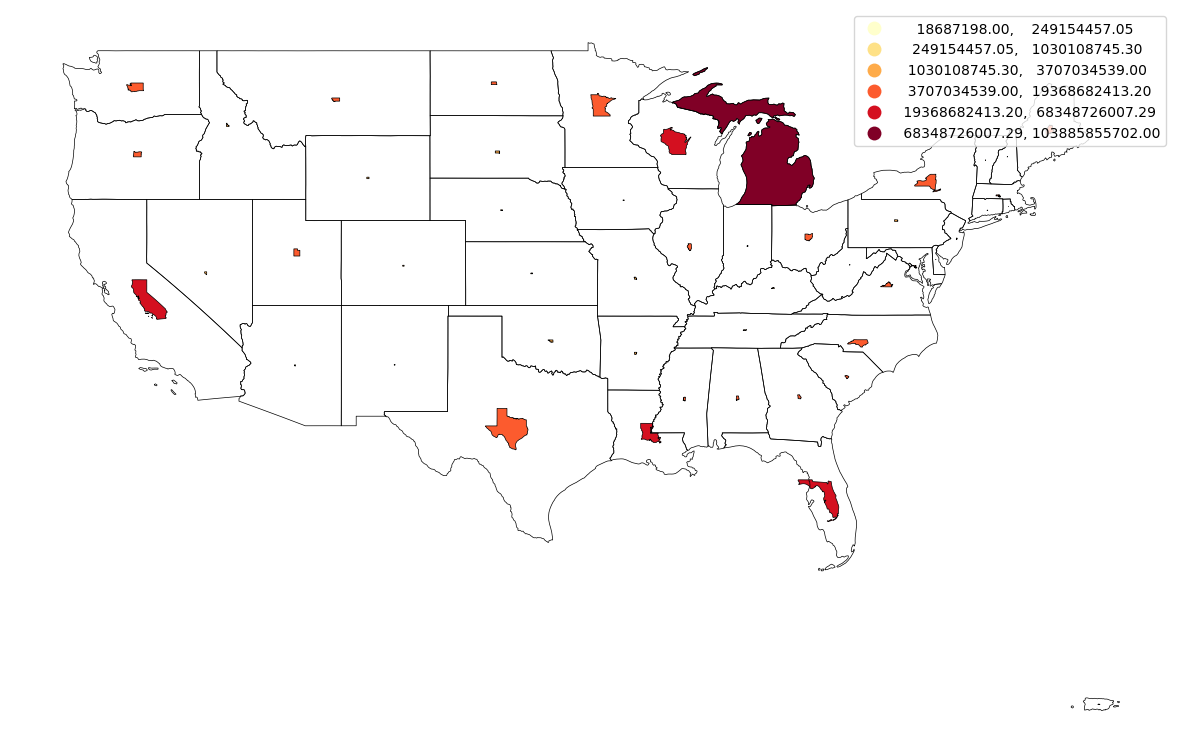
gsp.cartogram(
    usa,
    usa["AWATER"],
    cmap="Blues",
    figsize=(30, 30),
    legend_kwds={"loc": "lower left", "bbox_to_anchor": (0, 0.2), "prop": {"size": 22}},
    title="USA TOTAL WATER AREA",
    title_kwds={
        "fontsize": 50,
        "fontname": "sans-serif",
        "fontweight": 3,
        "loc": "right",
    },
)
gsp.cartogram(
    usa,
    usa["AWATER"],
    cartogram_only=True,
    cmap="Blues",
    figsize=(30, 30),
    legend_kwds={"loc": "lower left", "bbox_to_anchor": (0, 0.2), "prop": {"size": 22}},
    title="USA TOTAL WATER AREA",
    title_kwds={
        "fontsize": 50,
        "fontname": "sans-serif",
        "fontweight": 3,
        "loc": "right",
    },
)
- densityplot(data, base=None, clip=False, clip_factor=1.2, point_data=False, title=None, title_kwds={}, figsize=(15, 15), cmap='YlOrRd', facecolor='white', boundarycolor='black', boundary_linewidth=0.5, ax=None, axis_on=False, **geopandas_plot_kwds)
Plots a kde plot over a GeoDataFrame
- Parameters:
data (GeoDataFrame) – GeoDataFrame for which the map must be plotted
base (GeoDataFrame) – Base GeoDataFrame on top of which data must be plotted. Defaults to None.
clip (bool) – If True, the plot is clipped to geo data boundary. Defaults to False.
clip_factor (float) – Controls the scale of clipping mask, increase this if the plot is outside clipping boundary. Defaults to 1.2.
point_data (bool) – Must be true if the type of data being mapped is point shape. Defaults to False.
title (str) – Title of the map. Defaults to None.
title_kwds (dict) – Keyword arguments to matplotlib.pyplot.title. Defaults to {}.
figsize (tuple) – Figure size. Defaults to (15, 15).
cmap (str) – Colormap for the plot. Defaults to “YlOrRd”.
boundarycolor (str) – Map’s boundary color. Defaults to “black”.
boundary_linewidth (float) – Linewidth of boundaries. Defaults to 0.5.
ax (matplotlib axis) – axis must be passed if plotting needs to be done on an existing axis. Defaults to None.
axis_on (bool) – If True, axes will be visible. Defaults to False.
**geopandas_plot_kwds – Geopandas plot keyword arguments
facecolor – (Default value = “white”)
- Returns:
matplotlib axis object
- Return type:
ax
Examples
gsp.densityplot(usa)
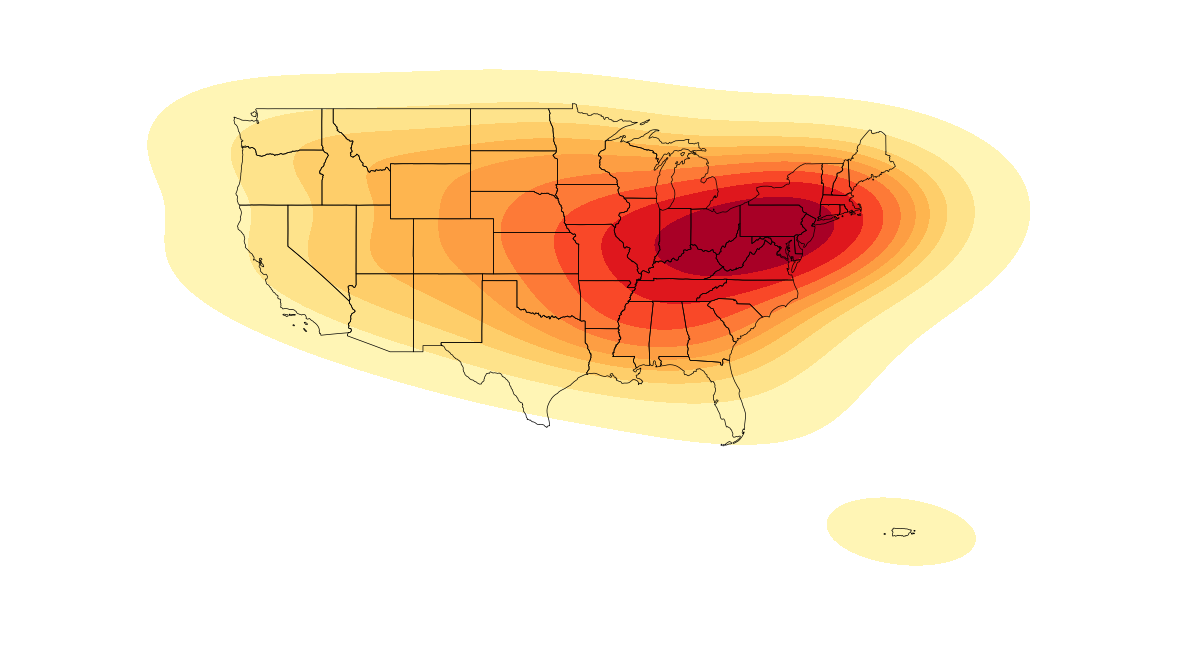
gsp.densityplot(usa, clip=True, clip_factor=1.5)
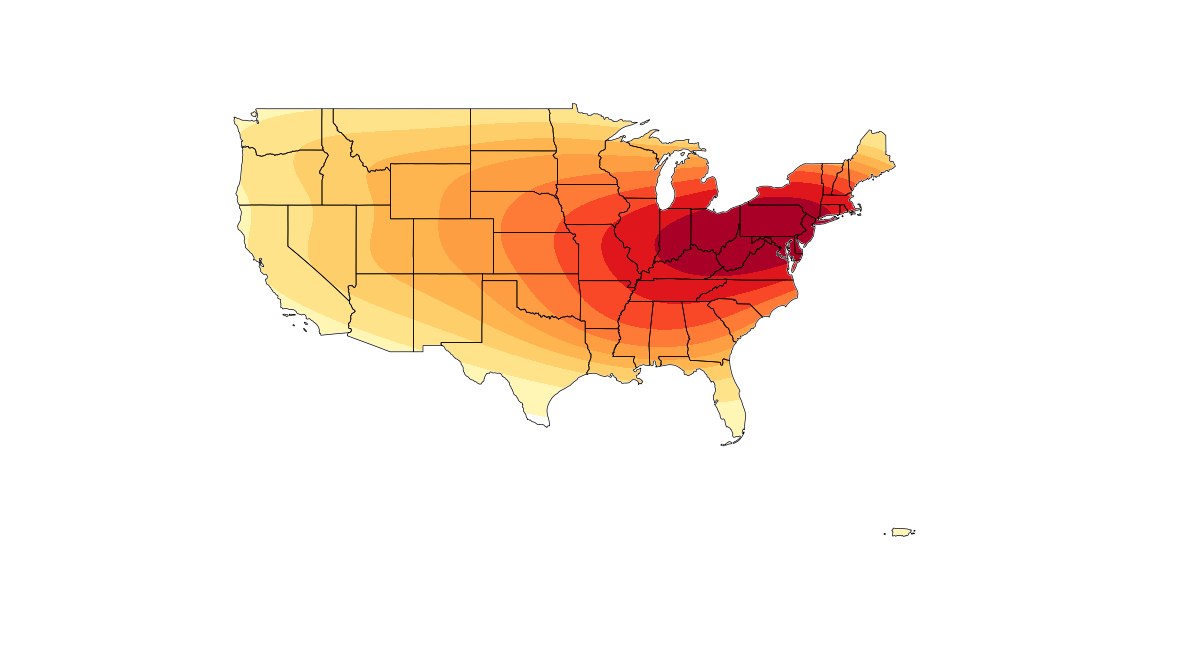
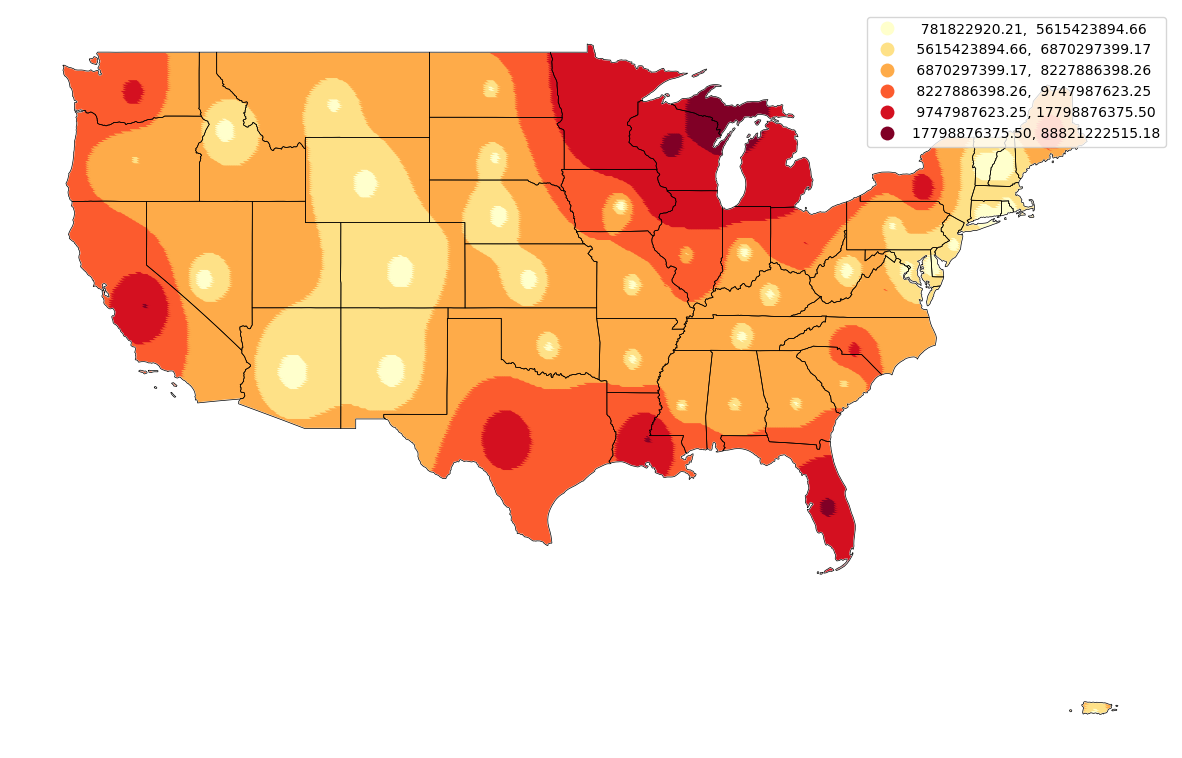
- heatmap(data, column, base=None, point_data=False, interpolate=False, interpolation_grid_space=0.05, clip=False, clip_factor=1.2, title=None, title_kwds={}, figsize=(15, 15), cmap='YlOrRd', facecolor='white', scheme='percentiles', boundarycolor='black', boundary_linewidth=0.5, legend=True, ax=None, annot=False, annot_column=None, annot_align='center', annot_kwds={}, axis_on=False, **geopandas_plot_kwds)
Plots heatmap. For polygons, the function returns a Choropleth map by default unless interpolated.
- Parameters:
data (GeoDataFrame) – GeoDataFrame for which the map must be plotted
column (str/GeoDataFrame column) – Column for which the plot should be plotted
base (GeoDataFrame) – Base GeoDataFrame on top of which data must be plotted. Defaults to None.
point_data (bool) – Must be true if the type of data being mapped is point shape. Defaults to False.
interpolate (bool) – If True, data is interpolated using KNN. Defaults to False.
interpolation_grid_space (float) – Grid Space for interpolation, Higher grid space needs more time and memory for interpolation. Defaults to 0.05.
clip (bool) – If True, the plot is clipped to geo data boundary. Defaults to False.
clip_factor (float) – Controls the scale of clipping mask, increase this if the plot is outside clipping boundary. Defaults to 1.2.
title (str) – Title of the map. Defaults to None.
title_kwds (dict) – Keyword arguments to matplotlib.pyplot.title. Defaults to {}.
figsize (tuple) – Figure size. Defaults to (15, 15).
cmap (str) – Colormap for the plot. Defaults to “YlOrRd”.
facecolor (str) – Figure’s face color. Defaults to “white”.
scheme (str) – mapclassify scheme for assigning colors. Defaults to “percentiles”.
boundarycolor (str) – Map’s boundary color. Defaults to “black”.
boundary_linewidth (float) – Linewidth of boundaries. Defaults to 0.5.
legend (bool) – If True, legend is displayed. Defaults to True.
annot (bool) – If True, annotations are generated. Defaults to False.
annot_column (str/GeoDataFrame column) – If annot is True, column should b passed as source for annotation. Defaults to None.
annot_align (str) – Text alignment for annotation. Defaults to “center”.
annot_kwds (dict) – Keyword arguments for annotation. Defaults to {}.
ax (matplotlib axis) – axis must be passed if plotting needs to be done on an existing axis. Defaults to None.
axis_on (bool) – If True, axes will be visible. Defaults to False.
**geopandas_plot_kwds – Geopandas plot keyword arguments
- Returns:
matplotlib axis object
- Return type:
ax
Examples
gsp.heatmap(usa, "AWATER")
gsp.heatmap(
    usa,
    "AWATER",
    interpolate=True,
    interpolation_grid_space=0.1,
    clip=True,
)
- spikemap(data, column, shape='triangle', spike_only=False, base=None, basecolor='#F1F3F4', baseboundarycolor='black', base_boundary=True, point_data=False, not_wgs84=False, x_scale_factor=10, y_scale_factor=10, title=None, title_kwds={}, figsize=(15, 15), linewidth=0.5, cmap='YlOrRd', edgecolor=None, facecolor='white', scheme='percentiles', boundarycolor='black', boundary_linewidth=0.5, legend=True, annot=False, annot_column=None, annot_align='center', annot_kwds={}, ax=None, axis_on=False, **geopandas_plot_kwds)
Generates a spikemap.
- Parameters:
data (GeoDataFrame) – GeoDataFrame for which the map must be plotted
column (str/GeoDataFrame column) – Column for which the plot should be plotted
shape (str) – Shape of spike, either rectangle or triangle. Defaults to “triangle”.
spike_only (bool) – If True, only spikes are returned without base map. Defaults to False.
base (GeoDataFrame) – Base GeoDataFrame on top of which data must be plotted. Defaults to None.
basecolor (str) – Color of the base data. Defaults to “#F1F3F4”.
baseboundarycolor (str) – Boundary color of the base data. Defaults to “black”.
base_boundary (bool) – If Base data boundaries should be visible. Defaults to True.
point_data (bool) – Must be true if the type of data being mapped is point shape. Defaults to False.
not_wgs84 (bool) – Needs to be true if data being plotted is not in WGS84/ESPG:4326. Defaults to False.
x_scale_factor (int) – Scale factor for base of the shape. Defaults to 10.
y_scale_factor (int) – Scale factor for height of the shape. Defaults to 10.
title (str) – Title of the map. Defaults to None.
title_kwds (dict) – Keyword arguments to matplotlib.pyplot.title. Defaults to {}.
figsize (tuple) – Figure size. Defaults to (15, 15).
linewidth (float) – Width of lines for shapes. Defaults to 0.5.
cmap (str) – Colormap for the plot. Defaults to “YlOrRd”.
edgecolor (str) – Map’s edge color. Defaults to “black”.
facecolor (str) – Figure’s face color. Defaults to “white”.
scheme (str) – mapclassify scheme for assigning colors. Defaults to “percentiles”.
boundarycolor (str) – Map’s boundary color. Defaults to “black”.
boundary_linewidth (float) – Linewidth of boundaries. Defaults to 0.5.
legend (bool) – If True, legend is displayed. Defaults to True.
annot (bool) – If True, annotations are generated. Defaults to False.
annot_column (str/GeoDataFrame column) – If annot is True, column should b passed as source for annotation. Defaults to None.
annot_align (str) – Text alignment for annotation. Defaults to “center”.
annot_kwds (dict) – Keyword arguments for annotation. Defaults to {}.
ax (matplotlib axis) – axis must be passed if plotting needs to be done on an existing axis. Defaults to None.
axis_on (bool) – If True, axes will be visible. Defaults to False.
**geopandas_plot_kwds – Geopandas plot keyword arguments
- Returns:
matplotlib axis object
- Return type:
ax
Examples
gsp.spikemap(usa, "AWATER")
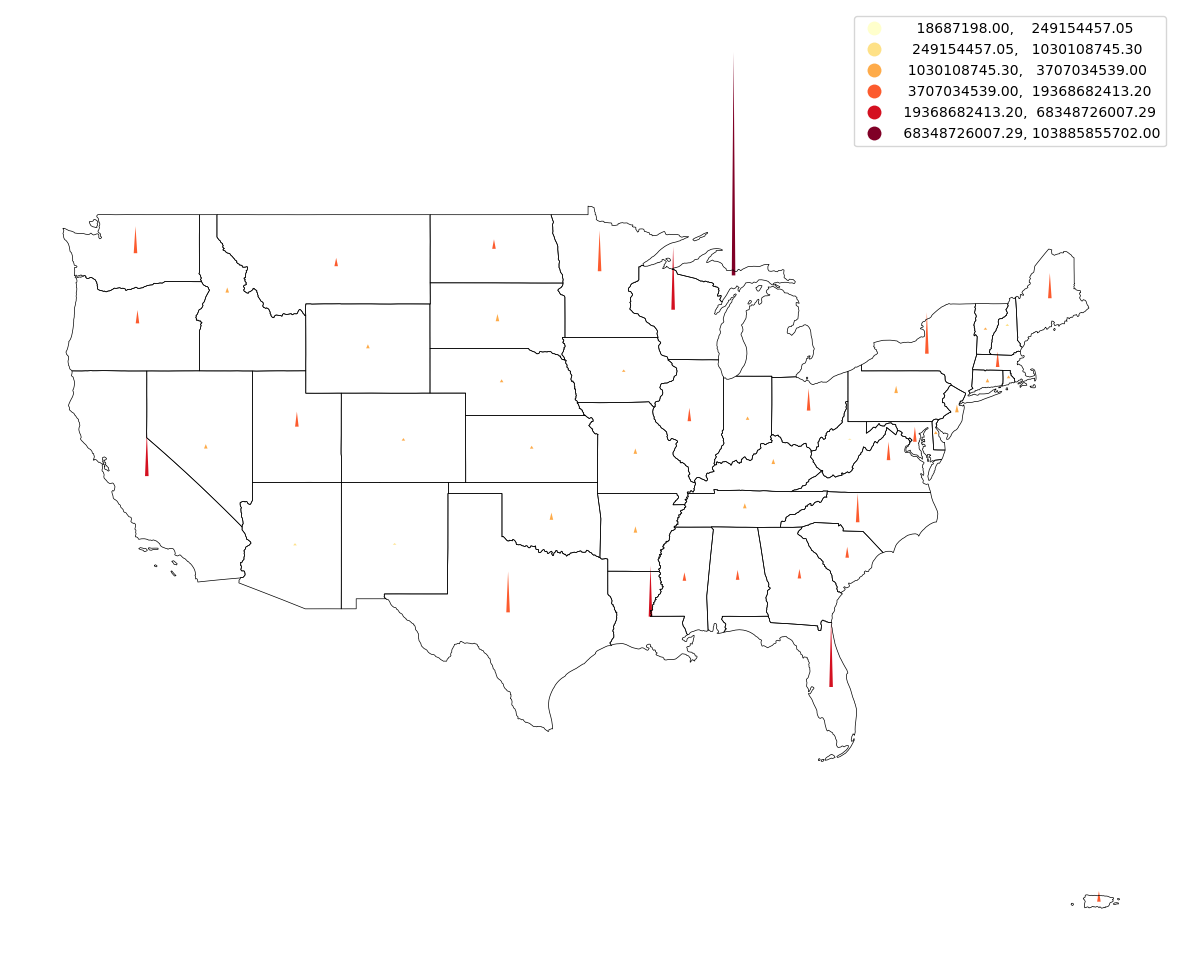
usa_moll = usa.to_crs("ESRI:54009")
gsp.spikemap(usa_moll, "AWATER", x_scale_factor=10, y_scale_factor=10, not_wgs84=True)
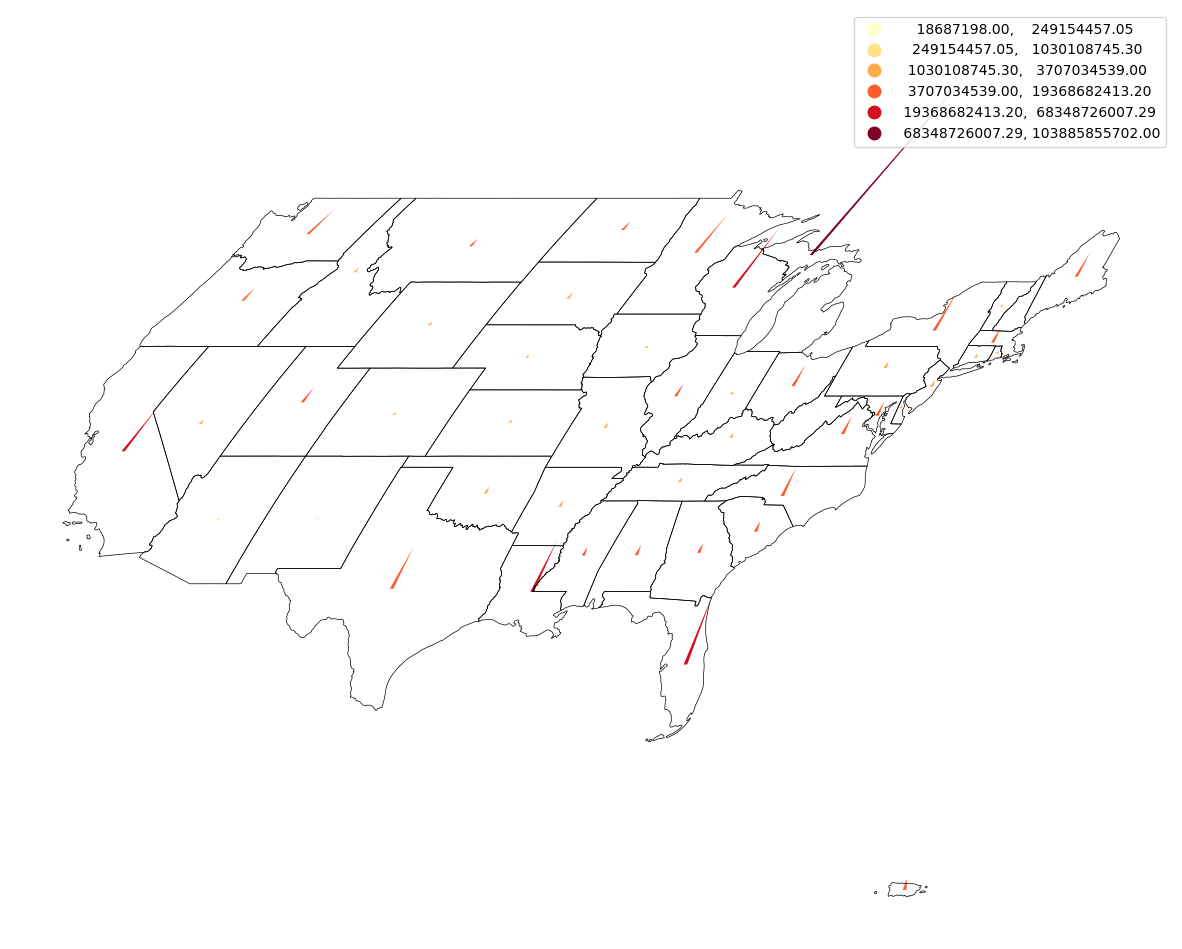
gsp.spikemap(usa, "AWATER", spike_only=True)
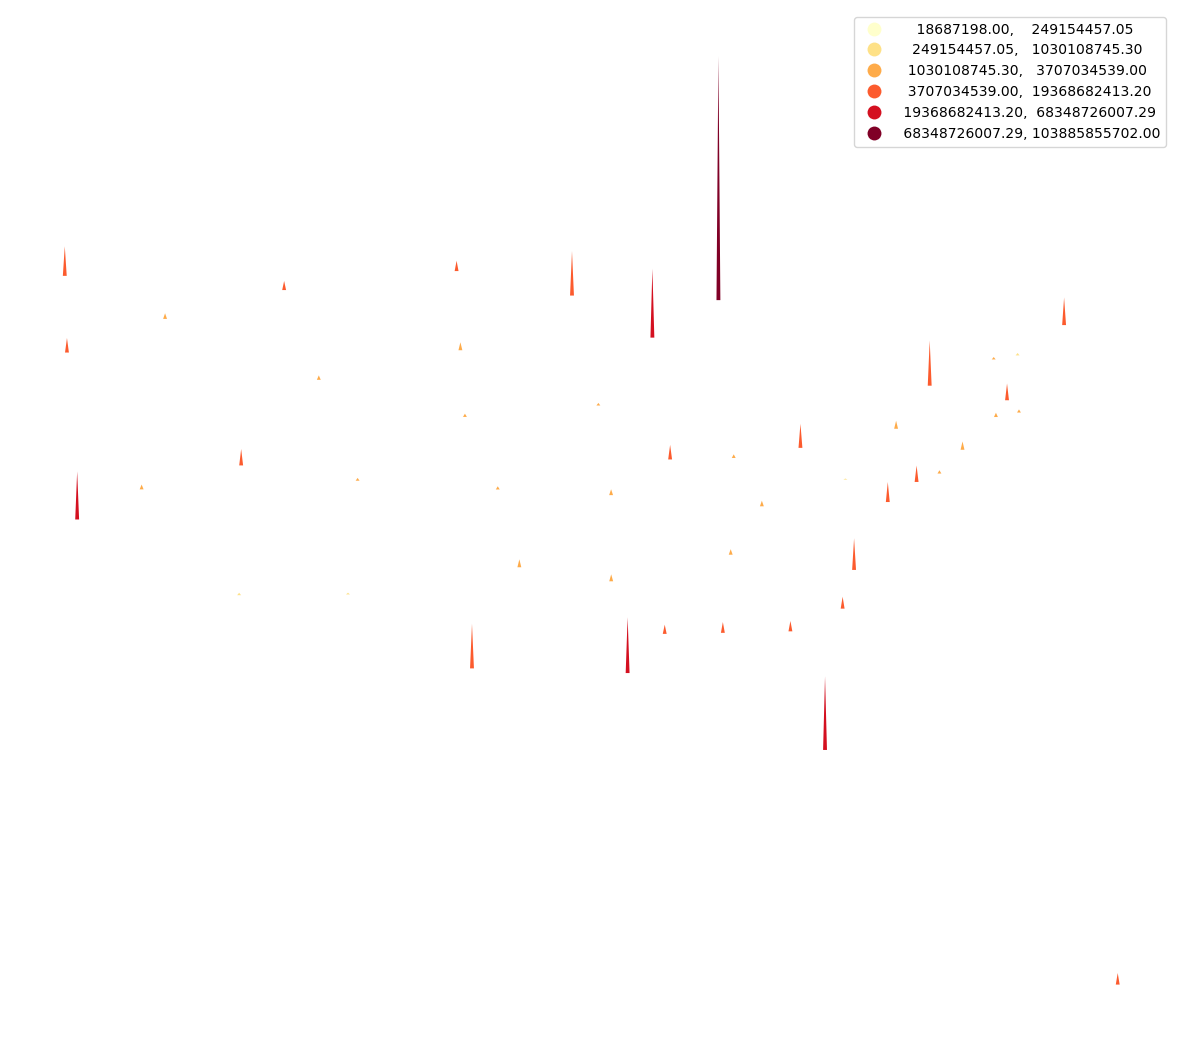
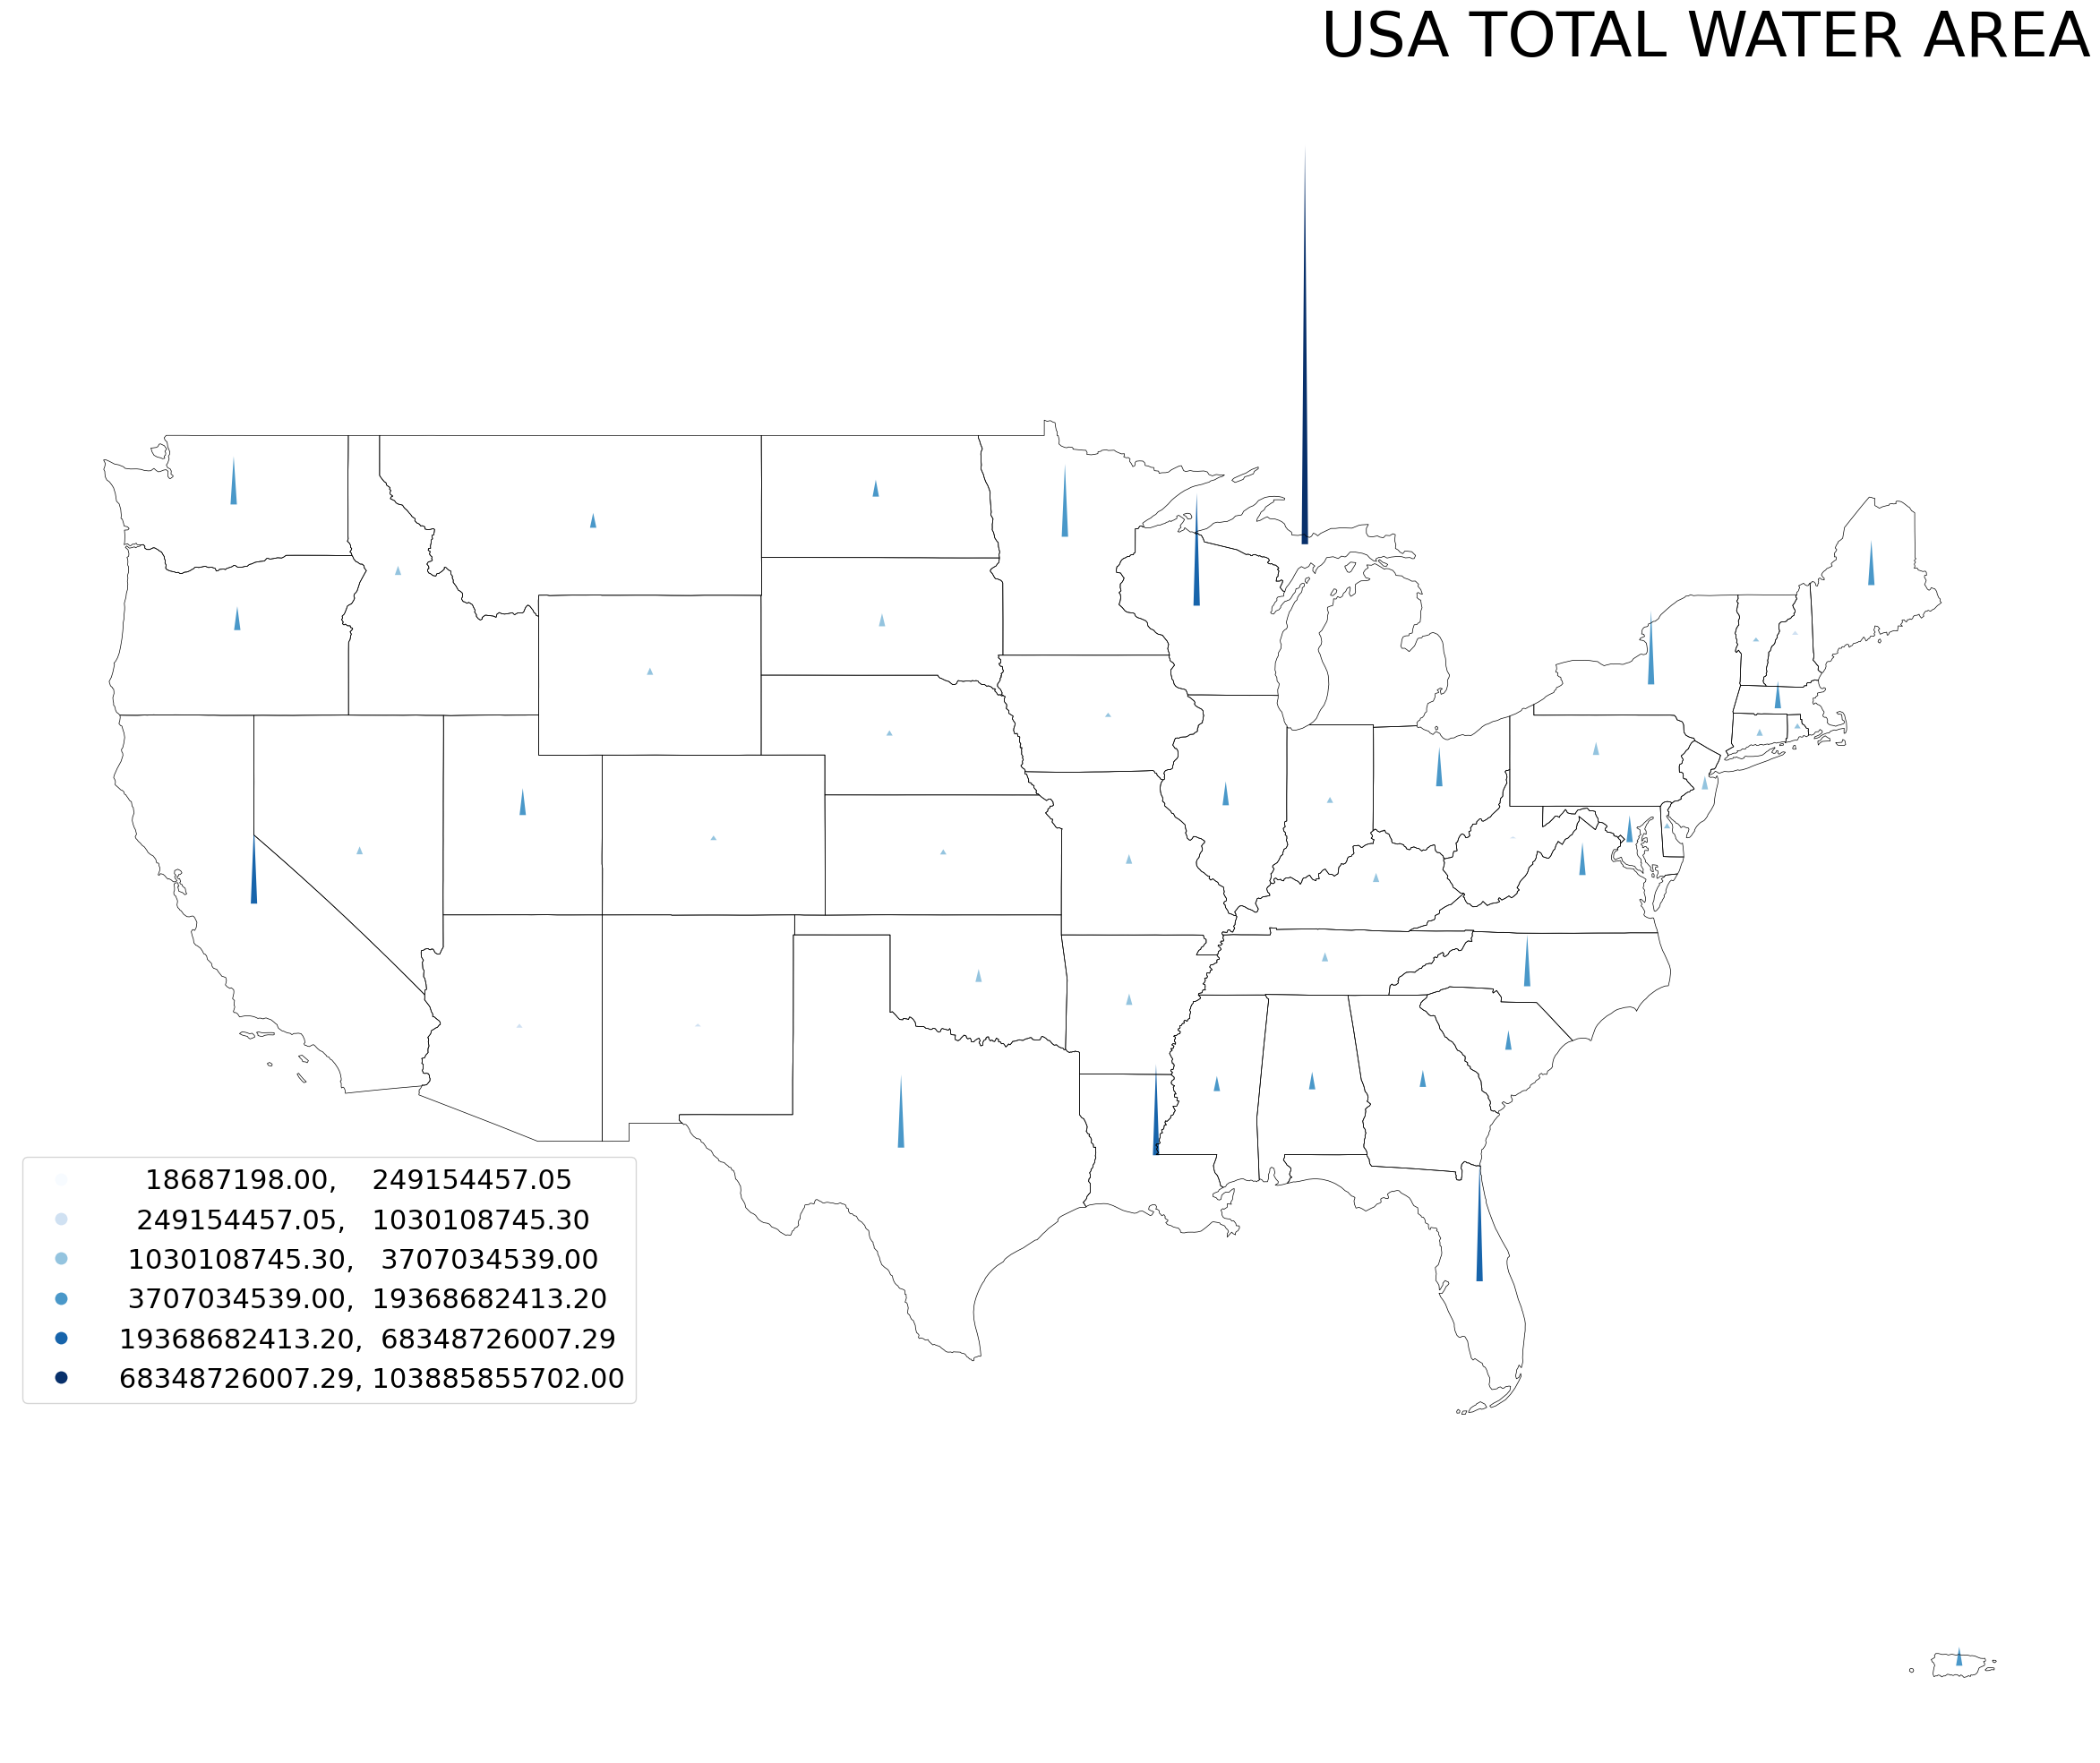
gsp.spikemap(
    usa,
    usa["AWATER"],
    cmap="Blues",
    figsize=(30, 30),
    legend_kwds={"loc": "lower left", "bbox_to_anchor": (0, 0.2), "prop": {"size": 22}},
    title="USA TOTAL WATER AREA",
    title_kwds={
        "fontsize": 50,
        "fontname": "sans-serif",
        "fontweight": 3,
        "loc": "right",
    },
)
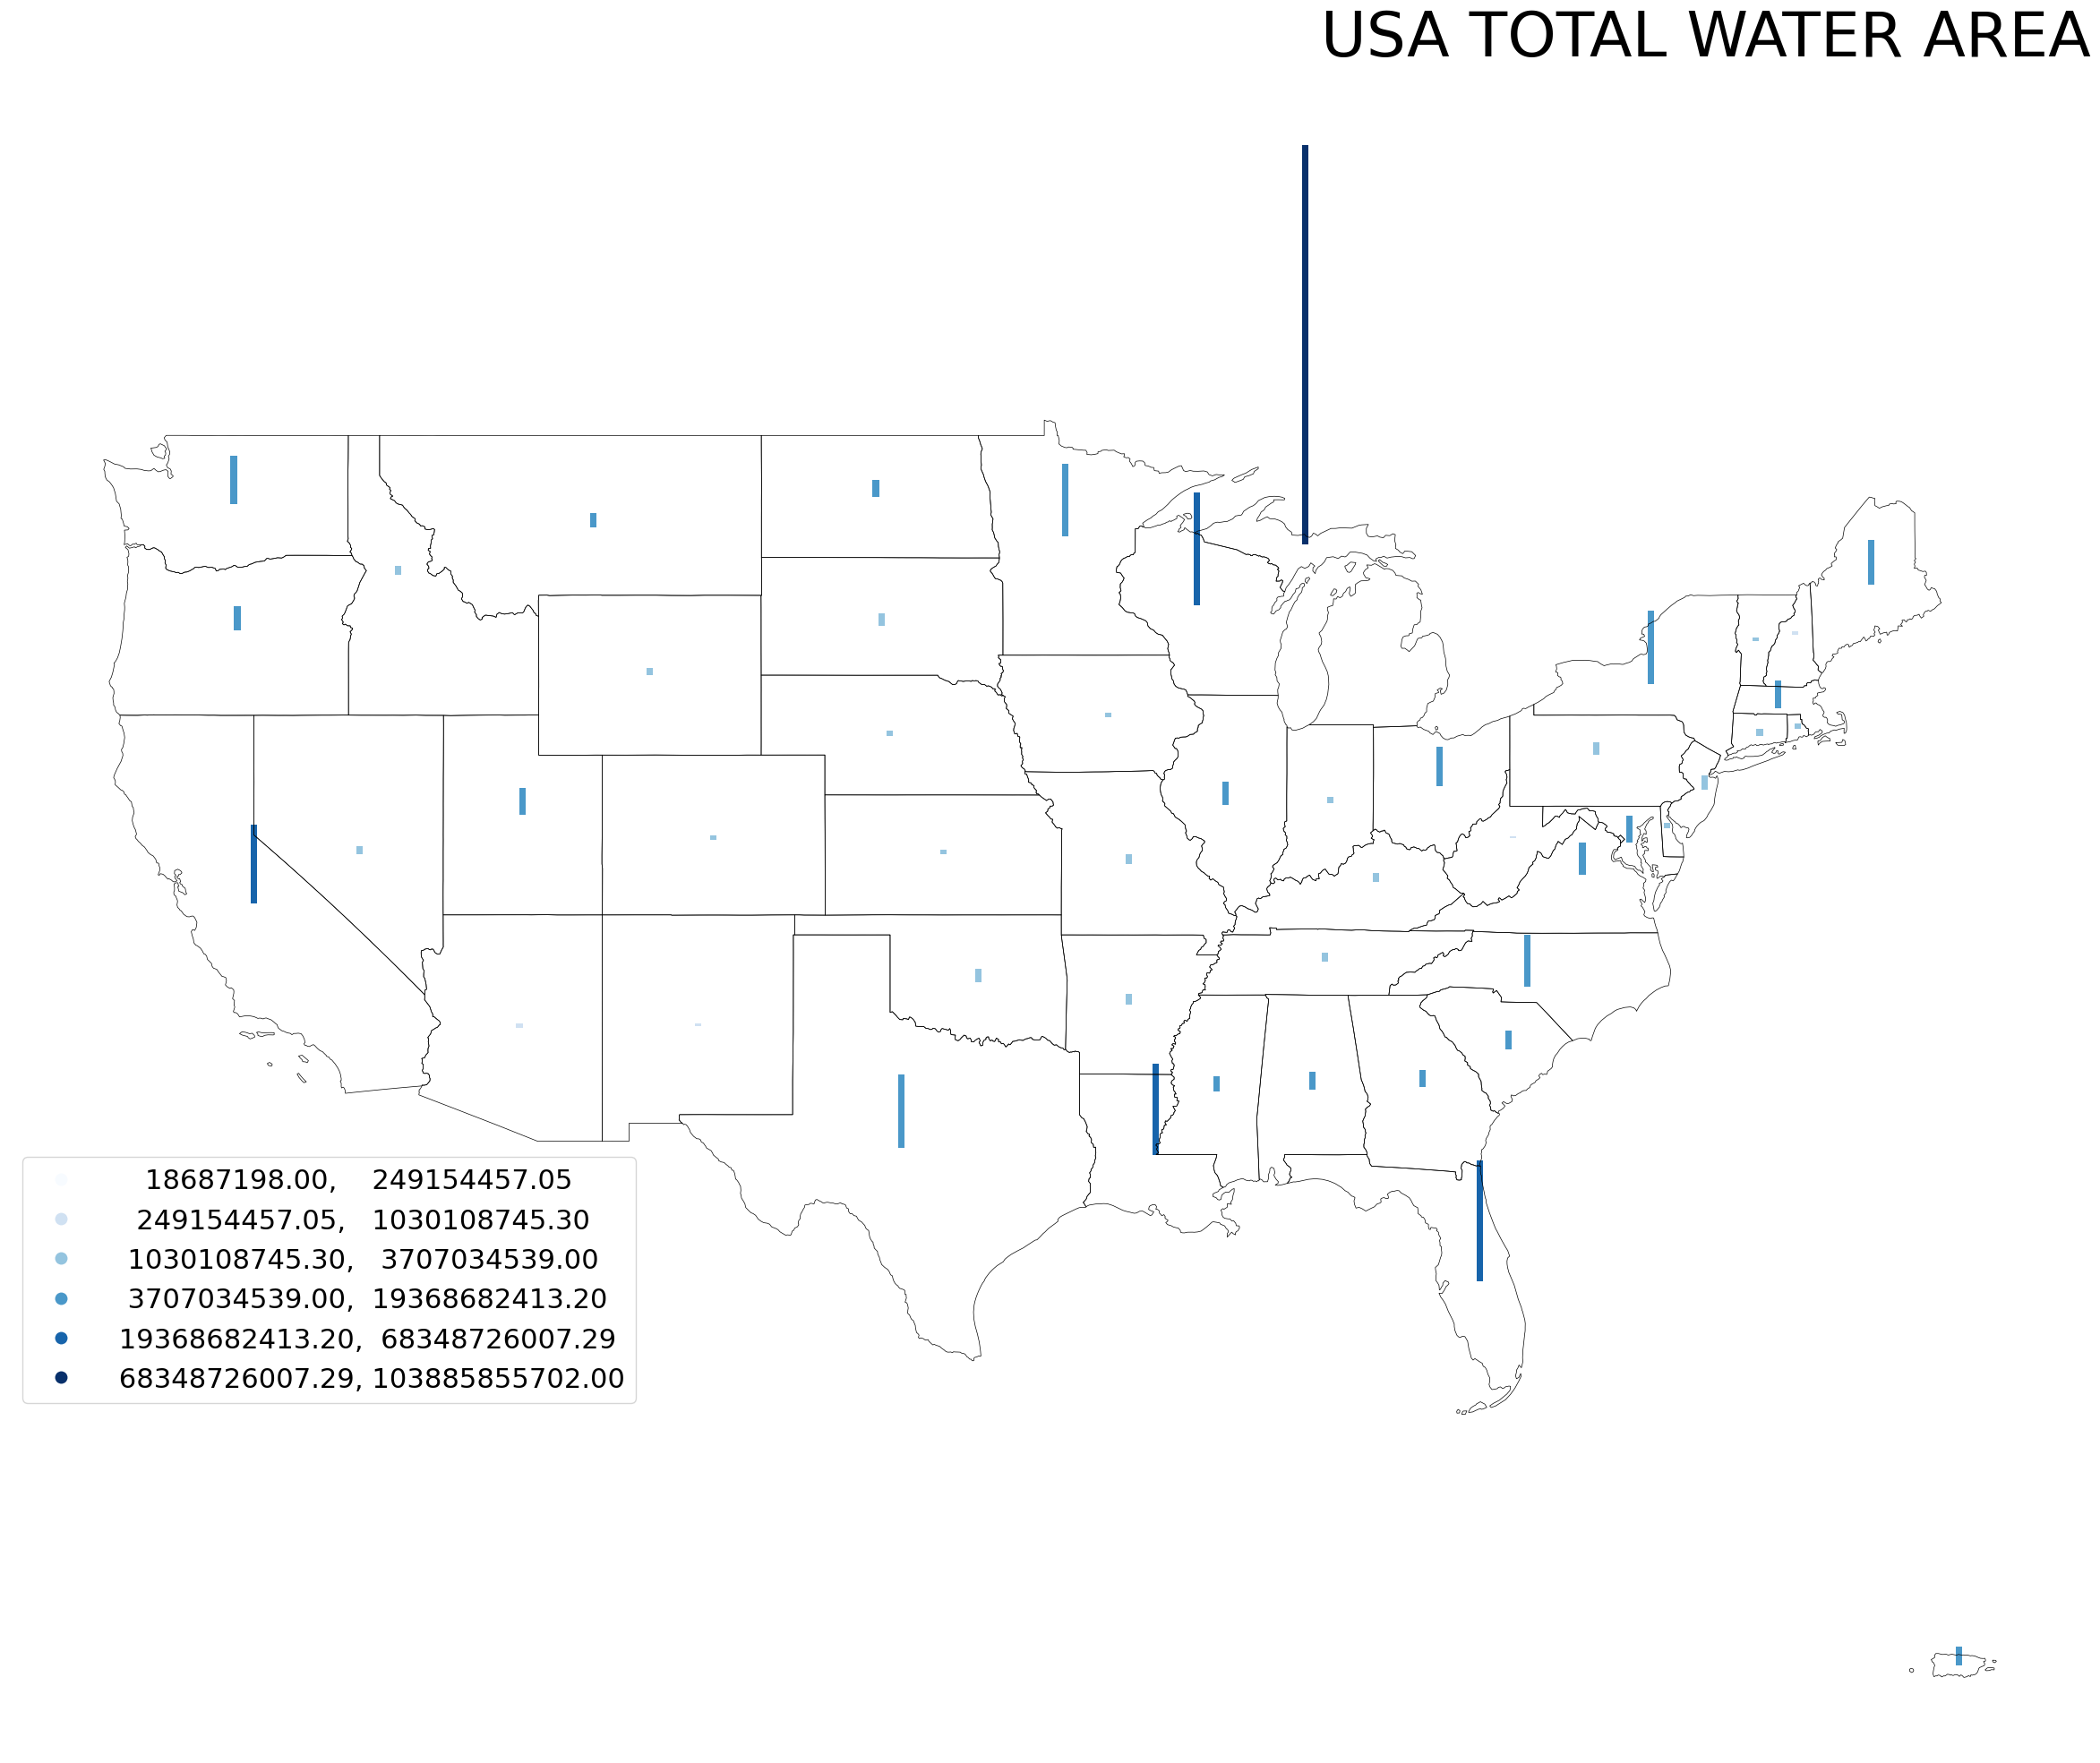
gsp.spikemap(
    usa,
    usa["AWATER"],
    shape="rectangle",
    cmap="Blues",
    figsize=(30, 30),
    legend_kwds={"loc": "lower left", "bbox_to_anchor": (0, 0.2), "prop": {"size": 22}},
    title="USA TOTAL WATER AREA",
    title_kwds={
        "fontsize": 50,
        "fontname": "sans-serif",
        "fontweight": 3,
        "loc": "right",
    },
)
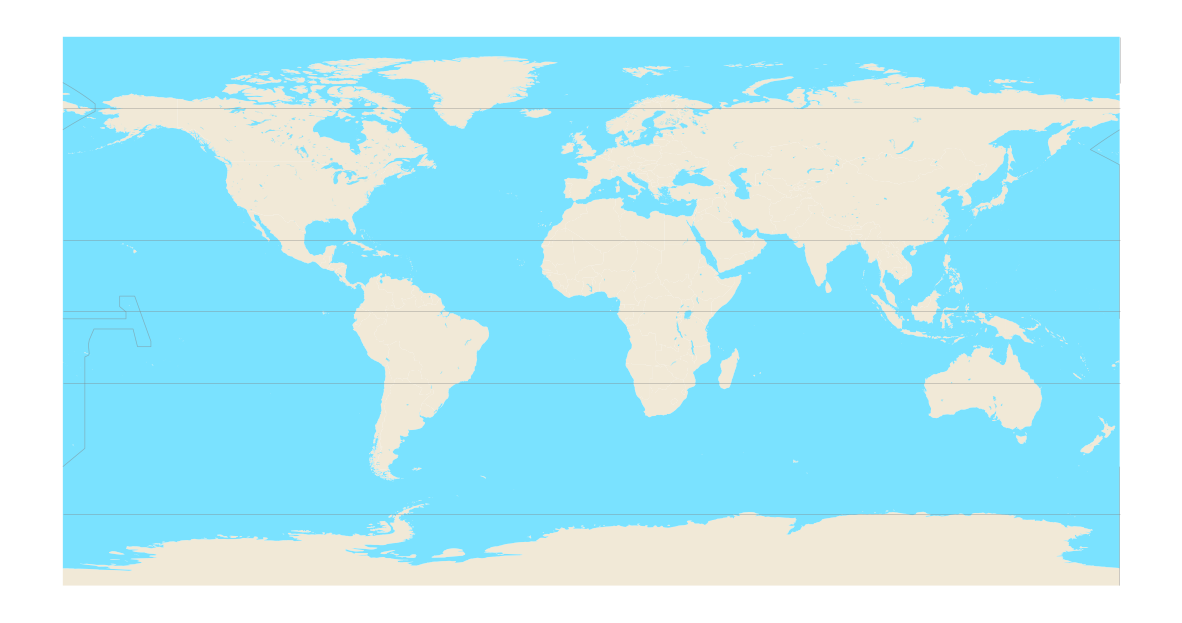
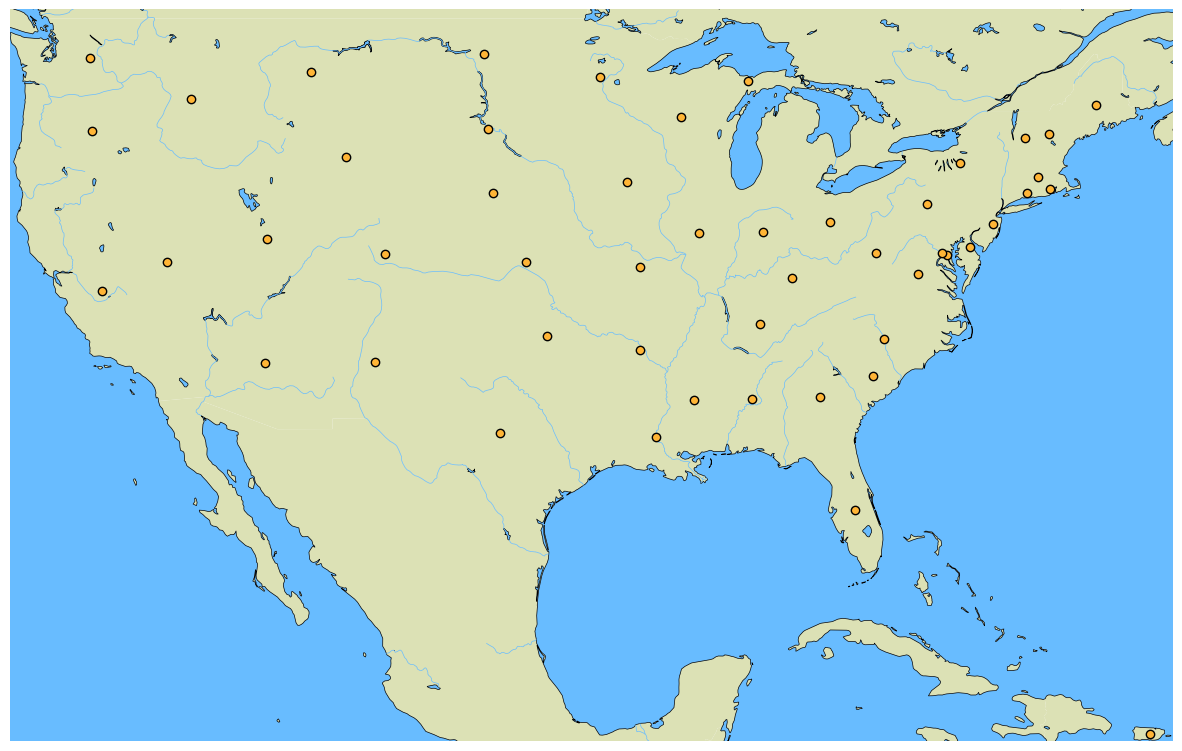
- offline_static_basemap(bounds=None, landcolor='#f1e9d7', watercolor='#7ae2ff', gridlinescolor='grey', gridlines_alpha=0.5, gridlines_width=0.5, figsize=(15, 15), title=None, title_kwds={}, facecolor='white', edgecolor='black', edgewidth=0, linewidth=0, ax=None, axis_on=False, **geopandas_plot_kwds)
Generates a static basemap that can be used as base for other plots. This function can be used without internet as the map is generated using naturalearth vector data.
- Parameters:
bounds (list/Geopandas Bounds) – Bounding box for clipping the basemap. Defaults to None.
landcolor (str) – Color of land. Defaults to “#f1e9d7”.
watercolor (str) – Color of water. Defaults to “#7ae2ff”.
gridlinescolor (str) – Color of gridlines. Defaults to “grey”.
gridlines_alpha (float) – Opacity of gridlines. Defaults to 0.5.
gridlines_width (float) – Linewidth of gridlines. Defaults to 0.5.
figsize (tuple) – Figure size. Defaults to (15, 15).
title (str) – Title of the map. Defaults to None.
title_kwds (dict) – Keyword arguments to matplotlib.pyplot.title. Defaults to {}.
facecolor (str) – Figure’s face color. Defaults to “white”.
edgecolor (str) – Map’s edge color. Defaults to “black”.
edgewidth (int) – Width of edges. Defaults to 0.
linewidth (int) – Width of boundaries. Defaults to 0.
ax (matplotlib axis) – axis must be passed if plotting needs to be done on an existing axis. Defaults to None.
axis_on (bool) – If True, axes will be visible. Defaults to False.
**geopandas_plot_kwds – Geopandas plot keyword arguments
- Returns:
matplotlib axis object
- Return type:
ax
Examples
gsp.offline_static_basemap()
ax = gsp.offline_static_basemap(bounds=usa.total_bounds)
gsp.pointplot(usa_points, ax=ax)
ax = gsp.offline_static_basemap(
    bounds=usa.total_bounds,
    landcolor="#DCE1B5",
    watercolor="#68BCFF",
    gridlines_alpha=0,
    linewidth=0.5,
)
gsp.pointplot(usa_points, ax=ax)
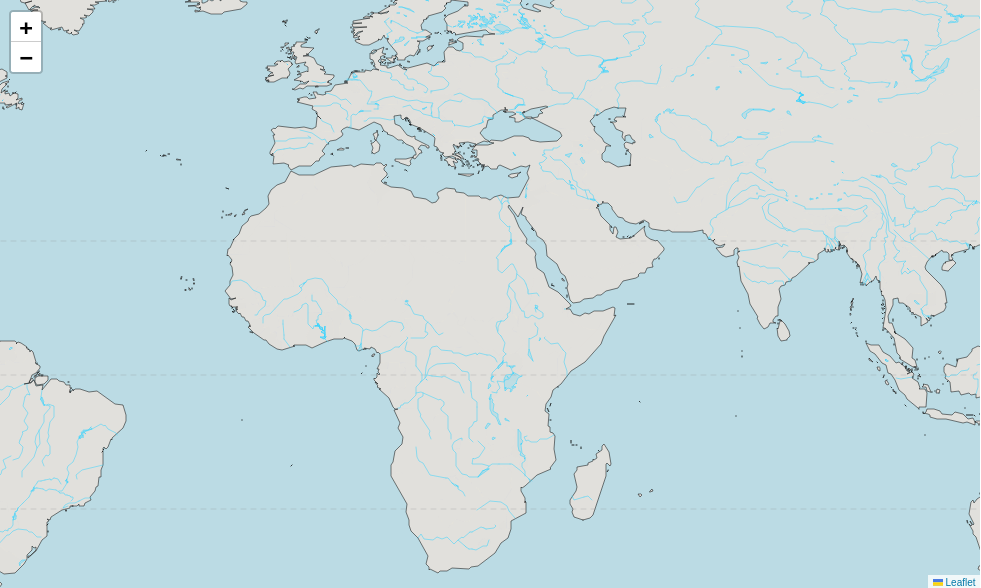
- offline_folium_basemap(location=[0, 0], landcolor='#f1e9d7', watercolor='#32d2ff', gridlinescolor='grey', gridlines_opacity=0.5, gridlines_weight=0.5, dash_array='5,5', edgecolor='black', borders=0, linewidth=0.5, zoom_start=2, max_zoom=5, style_function=None, **folium_kwds)
Generates a interactive folium basemap that can be used as base for other plots. This function can be used without internet as the map is generated using naturalearth vector data.
- Parameters:
location (list) – Location to center the basemap. Defaults to [0, 0].
landcolor (str) – Color of land. Defaults to “#f1e9d7”.
watercolor (str) – Color of water. Defaults to “#32d2ff”.
gridlinescolor (str) – Color of gridlines. Defaults to “grey”.
gridlines_opacity (float) – Opacity of gridlines. Defaults to 0.5.
gridlines_weight (float) – Linewidth of gridlines. Defaults to 0.5.
dash_array (str) – Dash array parameter of folium map. Defaults to “5, 5”.
edgecolor (str) – Color of edges. Defaults to “black”.
borders (int) – Line width of borders. Defaults to 0.
linewidth (float) – Linewidth of shapes. Defaults to 0.5.
zoom_start (int) – Zoom start parameter of folium map. Defaults to 2.
max_zoom (int) – Max zoom paraperter f folium map. Defaults to 5.
style_function (_type_) – Folium style function. Defaults to None.
**folium_kwds – Folium keywords
- Returns:
Folium map object
- Return type:
m
Examples
gsp.offline_folium_basemap(crs="EPSG4326")
- plot_xarray_raster(data, field=None, title=None, title_kwds={}, figsize=(15, 15), cmap='YlOrRd', clip_bbox=False, bounds=None, bounds_crs=None, clip_gdf=False, gdf=None, lower_limit=None, upper_limit=None, facecolor='white', robust=True, legend_kwds={}, ax=None, axis_on=False, **xarray_plot_kwds)
Plots raster xarray data and returns axis. This is a wrapper around xarray plot function.
- Parameters:
data (xarray Dataset/DataArray) – Xarray raster data to plot
field (str) – The field of Dataset to plot. This is only applicable for Dataset. Defaults to None.
title (str) – Title for the plot. Defaults to None.
title_kwds (dict) – title_kwds (dict, optional): Keyword arguments to matplotlib.pyplot.title. Defaults to {}.
figsize (tuple) – Figure size. Defaults to (15, 15).
cmap (str) – Colormap for the plot. Defaults to “YlOrRd”.
clip_bbox (bool) – Clips to bounds if True. Defaults to False.
bounds (list) – Bounding box for clipping. Defaults to None.
bounds_crs (str) – CRS for Bounding Box. Defaults to None.
clip_gdf (bool) – Clips to a GeoDataFrame if True. Defaults to False.
gdf (GeoDataFrame) – GeoDataFrame to clip the raster. Defaults to None.
lower_limit (float) – Lower limit for the scale. Defaults to None.
upper_limit (float) – Upper limit for the scale. Defaults to None.
facecolor (str) – Figure’s face color. Defaults to “white”.
robust (bool) – Uses data between 2% to 98% for figure scale if True. Defaults to True.
legend_kwds (dict) – Keywords for colorbar/legend. Defaults to {}.
ax (matplotlib axis) – axis must be passed if plotting needs to be done on an existing axis. Defaults to None.
axis_on (bool) – If True, axes will be visible. Defaults to False.
**xarray_plot_kwds –
Keywords for xarray plot.
- Returns:
matplotlib axis object
- Return type:
ax
Examples
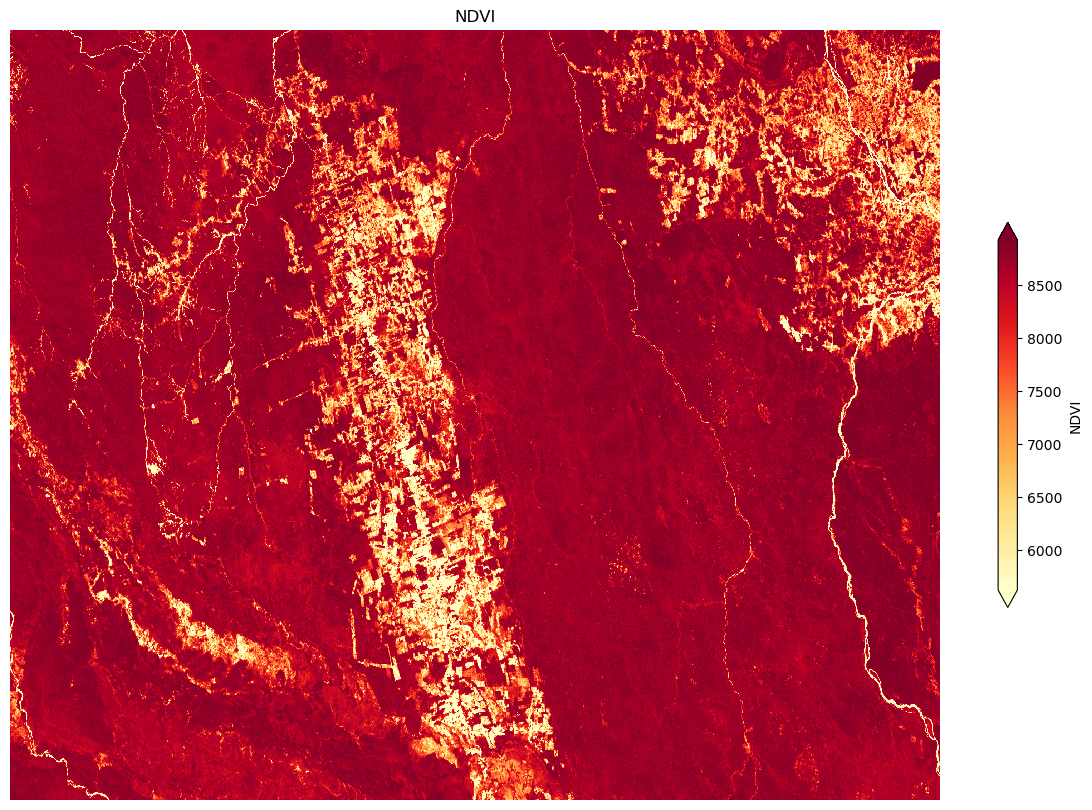
gsp.plot_xarray_raster(data, title="NDVI", legend_kwds={ "label":"NDVI","shrink":.5})
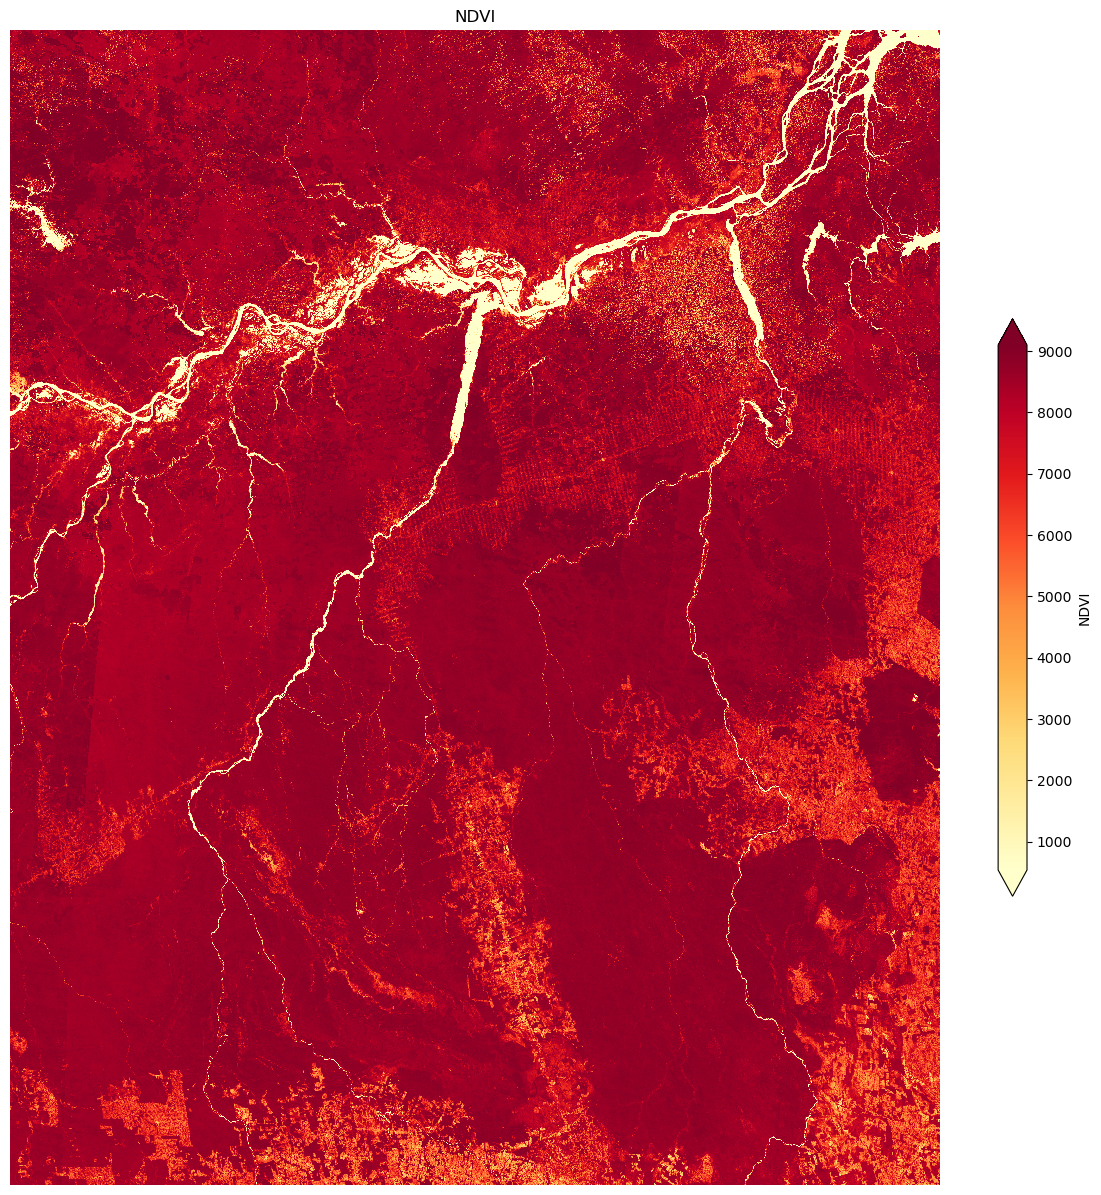
bounds = [-57.3733,-8.934,-52.2885,-5.909]
gsp.plot_xarray_raster(data,
                   title="NDVI",
                   legend_kwds={ "label":"NDVI","shrink":.5},
                   clip_bbox=True,
                   bounds=bounds,
                   bounds_crs="epsg:4326",
                   figsize=(15,10)
                  )
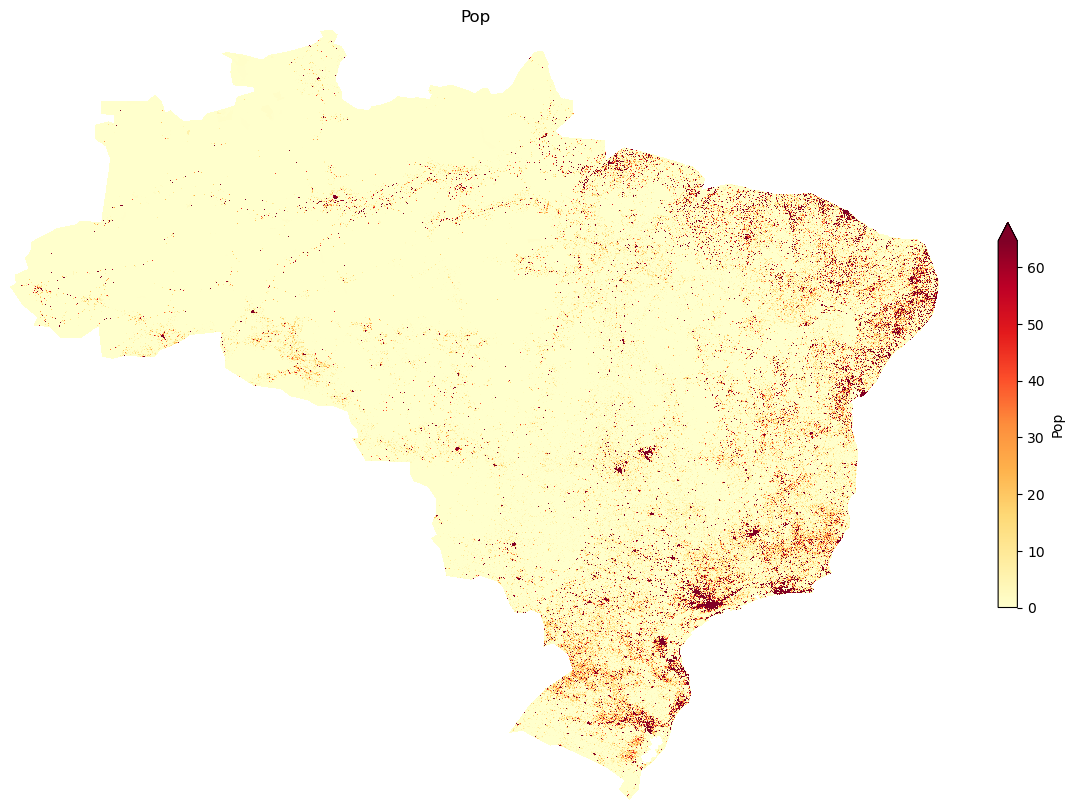
data = rioxarray.open_rasterio("GHS_POP_E2020_GLOBE_R2022A_54009_1000_V1_0.tif")
gdf = gpd.read_file("ne_110m_admin_0_countries.shp")
gdf = gdf[gdf["SOVEREIGNT"]=="Brazil"]
gsp.plot_xarray_raster(data,
                   title="Pop",
                   legend_kwds={ "label":"Pop","shrink":.5},
                   clip_gdf=True,
                   gdf=gdf,
                   lower_limit=0,
                   figsize=(15,10),
                  )
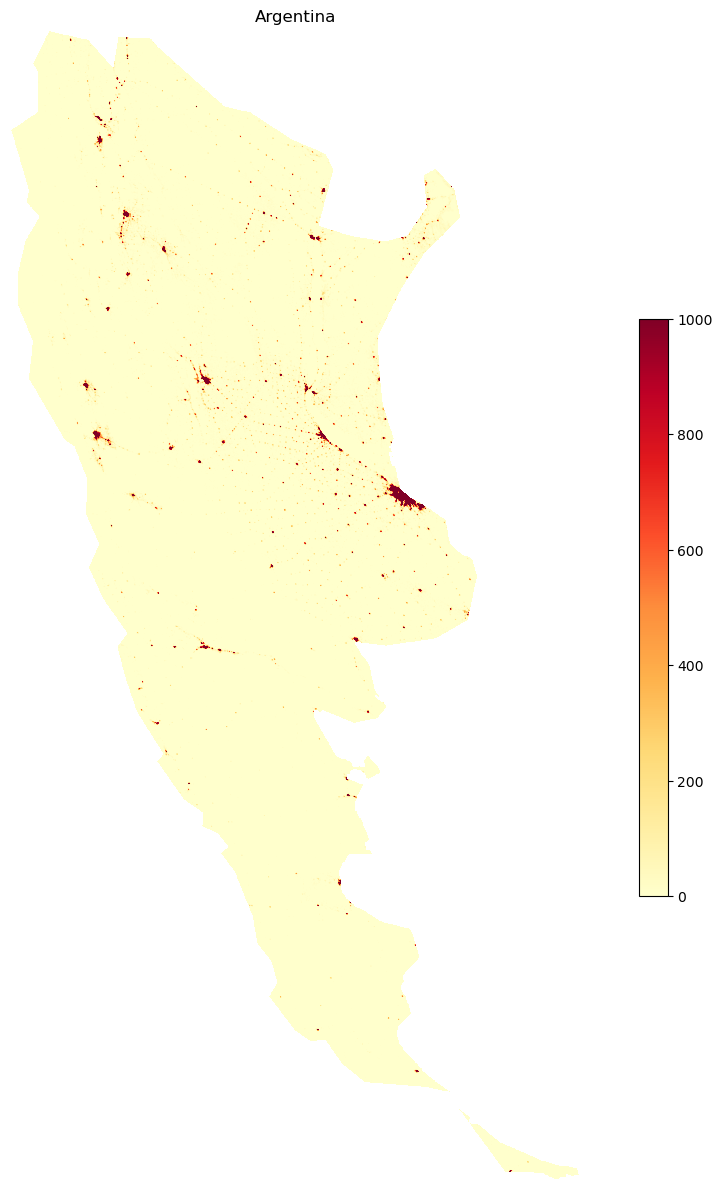
- show_raster(data, title=None, title_kwds={}, figsize=(15, 15), cmap='YlOrRd', facecolor='white', colorbar=False, legend_kwds={}, ax=None, axis_on=False, **show_kwds)
Wrapper around rasterio show with additional functionalities like better defaults and colorbar.
- Parameters:
data (rasterio DatasetReader) – Data to plot
title (str) – Title for the plot. Defaults to None.
title_kwds (dict) – title_kwds (dict, optional): Keyword arguments to matplotlib.pyplot.title. Defaults to {}.
figsize (tuple) – Figure size. Defaults to (15, 15).
cmap (str) – Colormap for the plot. Defaults to “YlOrRd”.
facecolor (str) – Figure’s face color. Defaults to “white”.
colorbar (bool) – Inserts colorbar if True. Defaults to False.
legend_kwds (dict) – Keywords for colorbar/legend. Defaults to {}.
ax (matplotlib axis) – axis must be passed if plotting needs to be done on an existing axis. Defaults to None.
axis_on (bool) – If True, axes will be visible. Defaults to False.
**show_kwds –
Keywords for rasterio show function.
- Returns:
matplotlib axis object
- Return type:
ax
Examples
gsp.show_raster(data, title="Argentina", colorbar=True, legend_kwds={"shrink":0.5}, vmin=0, vmax=1000)